Blackfeet vs Honduran Female Unemployment
COMPARE
Blackfeet
Honduran
Female Unemployment
Female Unemployment Comparison
Blackfeet
Hondurans
5.9%
FEMALE UNEMPLOYMENT
0.0/ 100
METRIC RATING
265th/ 347
METRIC RANK
5.9%
FEMALE UNEMPLOYMENT
0.0/ 100
METRIC RATING
268th/ 347
METRIC RANK
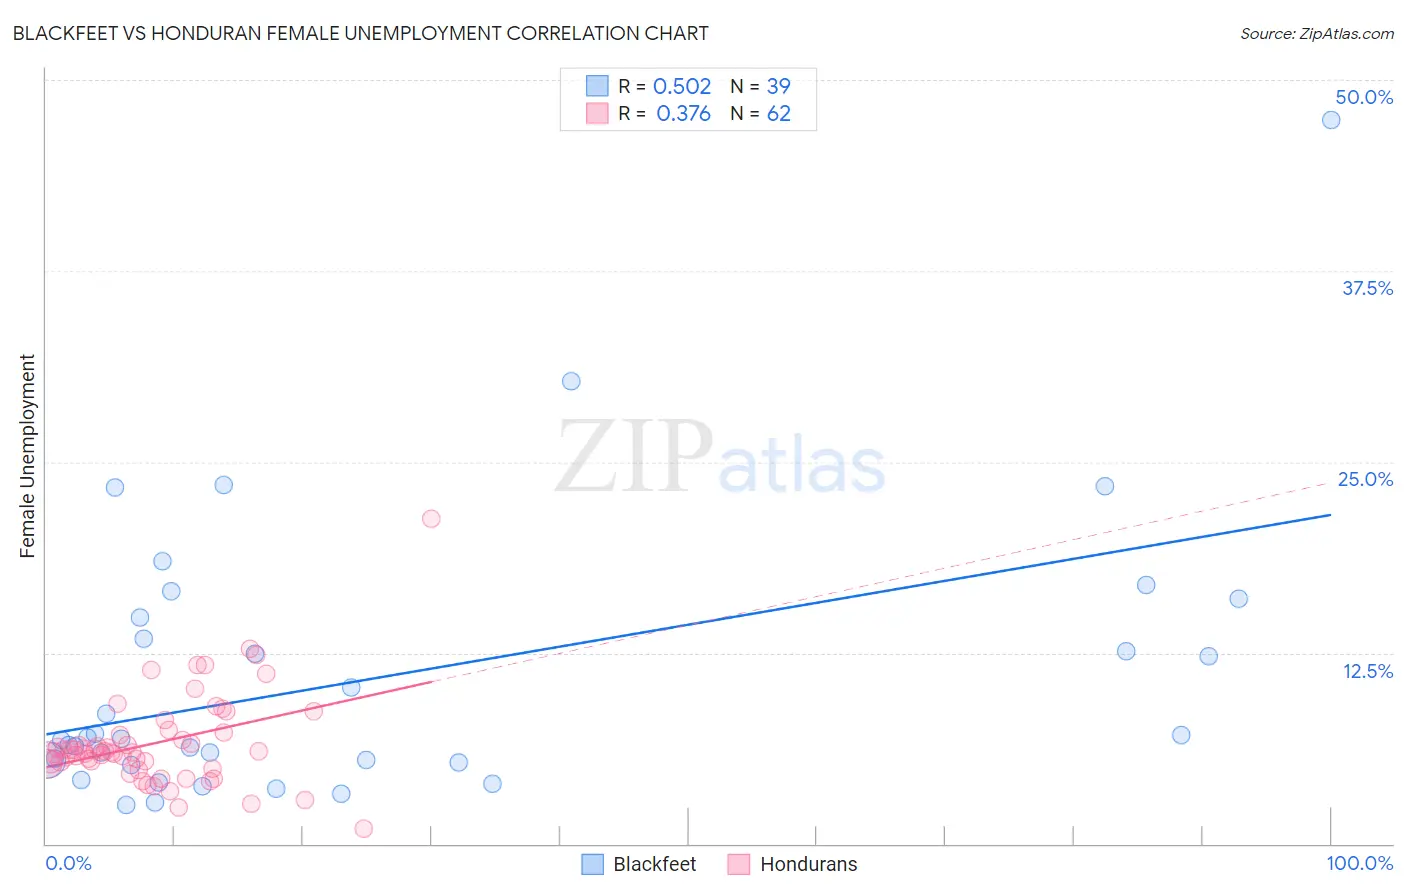
Blackfeet vs Honduran Female Unemployment Correlation Chart
The statistical analysis conducted on geographies consisting of 308,006,110 people shows a substantial positive correlation between the proportion of Blackfeet and unemploymnet rate among females in the United States with a correlation coefficient (R) of 0.502 and weighted average of 5.9%. Similarly, the statistical analysis conducted on geographies consisting of 356,669,168 people shows a mild positive correlation between the proportion of Hondurans and unemploymnet rate among females in the United States with a correlation coefficient (R) of 0.376 and weighted average of 5.9%, a difference of 0.48%.
Female Unemployment Correlation Summary
| Measurement | Blackfeet | Honduran |
| Minimum | 2.5% | 1.0% |
| Maximum | 47.4% | 21.3% |
| Range | 44.9% | 20.3% |
| Mean | 10.8% | 6.6% |
| Median | 6.9% | 6.0% |
| Interquartile 25% (IQ1) | 5.3% | 5.2% |
| Interquartile 75% (IQ3) | 14.8% | 7.3% |
| Interquartile Range (IQR) | 9.5% | 2.1% |
| Standard Deviation (Sample) | 9.1% | 3.1% |
| Standard Deviation (Population) | 9.0% | 3.1% |
Demographics Similar to Blackfeet and Hondurans by Female Unemployment
In terms of female unemployment, the demographic groups most similar to Blackfeet are Cape Verdean (5.9%, a difference of 0.28%), Nepalese (5.9%, a difference of 0.39%), Immigrants from Bahamas (5.8%, a difference of 0.40%), Immigrants from Western Africa (5.9%, a difference of 0.69%), and Immigrants from the Azores (5.8%, a difference of 0.79%). Similarly, the demographic groups most similar to Hondurans are Nepalese (5.9%, a difference of 0.10%), Cape Verdean (5.9%, a difference of 0.20%), Immigrants from Western Africa (5.9%, a difference of 0.20%), Immigrants from Honduras (5.9%, a difference of 0.61%), and Central American (5.9%, a difference of 0.72%).
| Demographics | Rating | Rank | Female Unemployment |
| Sub-Saharan Africans | 0.4 /100 | #256 | Tragic 5.7% |
| Dutch West Indians | 0.3 /100 | #257 | Tragic 5.7% |
| Immigrants | Portugal | 0.2 /100 | #258 | Tragic 5.8% |
| Immigrants | Fiji | 0.2 /100 | #259 | Tragic 5.8% |
| Nigerians | 0.2 /100 | #260 | Tragic 5.8% |
| Kiowa | 0.1 /100 | #261 | Tragic 5.8% |
| Immigrants | Nigeria | 0.1 /100 | #262 | Tragic 5.8% |
| Immigrants | Azores | 0.1 /100 | #263 | Tragic 5.8% |
| Immigrants | Bahamas | 0.1 /100 | #264 | Tragic 5.8% |
| Blackfeet | 0.0 /100 | #265 | Tragic 5.9% |
| Cape Verdeans | 0.0 /100 | #266 | Tragic 5.9% |
| Nepalese | 0.0 /100 | #267 | Tragic 5.9% |
| Hondurans | 0.0 /100 | #268 | Tragic 5.9% |
| Immigrants | Western Africa | 0.0 /100 | #269 | Tragic 5.9% |
| Immigrants | Honduras | 0.0 /100 | #270 | Tragic 5.9% |
| Central Americans | 0.0 /100 | #271 | Tragic 5.9% |
| Lumbee | 0.0 /100 | #272 | Tragic 5.9% |
| Ghanaians | 0.0 /100 | #273 | Tragic 5.9% |
| Africans | 0.0 /100 | #274 | Tragic 5.9% |
| Senegalese | 0.0 /100 | #275 | Tragic 6.0% |
| Bahamians | 0.0 /100 | #276 | Tragic 6.0% |