Blackfeet vs Latvian Female Unemployment
COMPARE
Blackfeet
Latvian
Female Unemployment
Female Unemployment Comparison
Blackfeet
Latvians
5.9%
FEMALE UNEMPLOYMENT
0.0/ 100
METRIC RATING
265th/ 347
METRIC RANK
4.7%
FEMALE UNEMPLOYMENT
99.9/ 100
METRIC RATING
18th/ 347
METRIC RANK
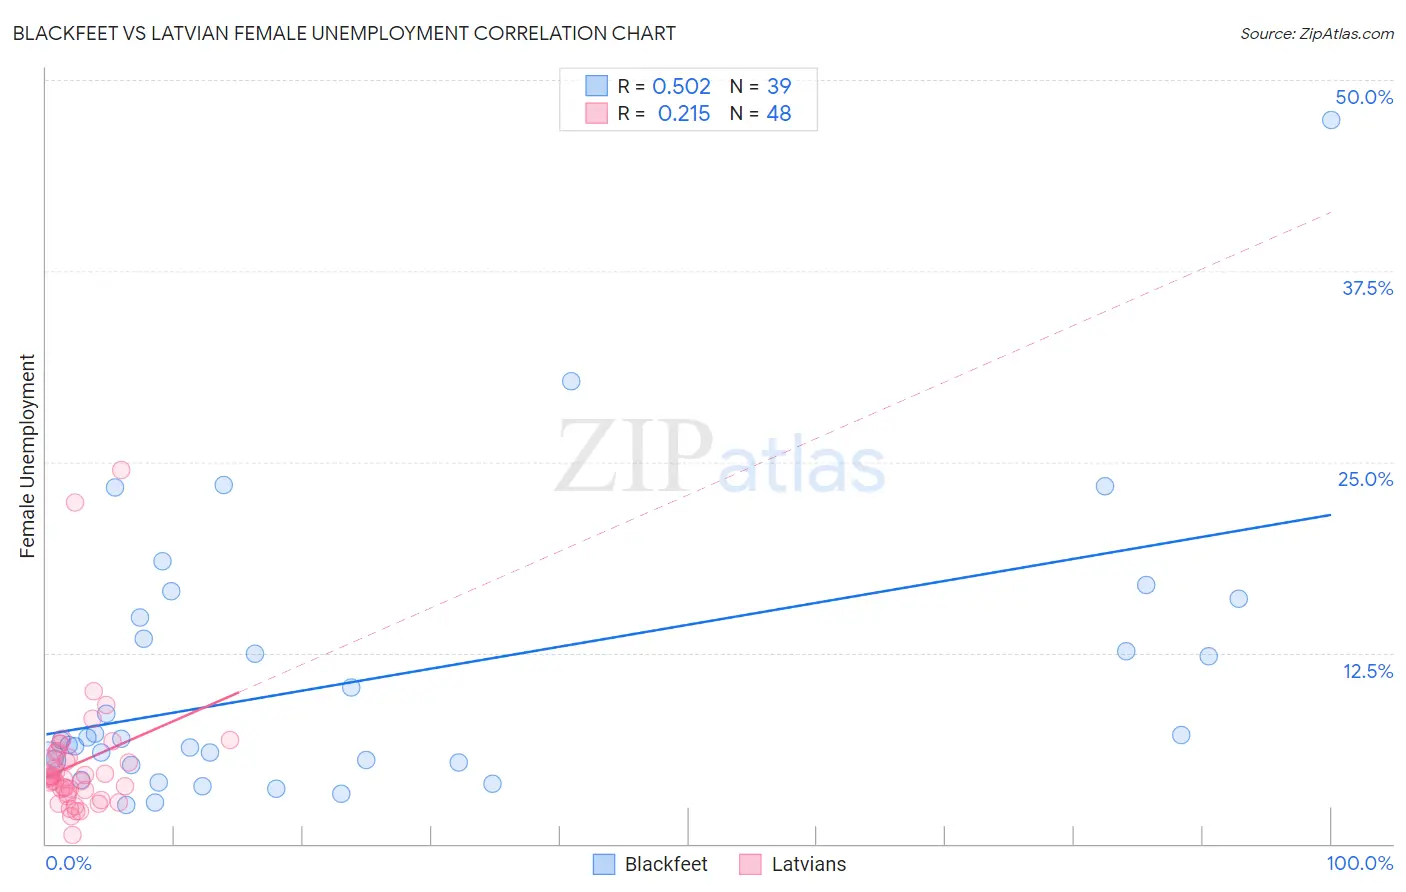
Blackfeet vs Latvian Female Unemployment Correlation Chart
The statistical analysis conducted on geographies consisting of 308,006,110 people shows a substantial positive correlation between the proportion of Blackfeet and unemploymnet rate among females in the United States with a correlation coefficient (R) of 0.502 and weighted average of 5.9%. Similarly, the statistical analysis conducted on geographies consisting of 220,201,927 people shows a weak positive correlation between the proportion of Latvians and unemploymnet rate among females in the United States with a correlation coefficient (R) of 0.215 and weighted average of 4.7%, a difference of 25.2%.
Female Unemployment Correlation Summary
| Measurement | Blackfeet | Latvian |
| Minimum | 2.5% | 0.60% |
| Maximum | 47.4% | 24.5% |
| Range | 44.9% | 23.9% |
| Mean | 10.8% | 5.3% |
| Median | 6.9% | 4.3% |
| Interquartile 25% (IQ1) | 5.3% | 3.4% |
| Interquartile 75% (IQ3) | 14.8% | 5.8% |
| Interquartile Range (IQR) | 9.5% | 2.4% |
| Standard Deviation (Sample) | 9.1% | 4.3% |
| Standard Deviation (Population) | 9.0% | 4.2% |
Similar Demographics by Female Unemployment
Demographics Similar to Blackfeet by Female Unemployment
In terms of female unemployment, the demographic groups most similar to Blackfeet are Cape Verdean (5.9%, a difference of 0.28%), Nepalese (5.9%, a difference of 0.39%), Immigrants from Bahamas (5.8%, a difference of 0.40%), Honduran (5.9%, a difference of 0.48%), and Immigrants from Western Africa (5.9%, a difference of 0.69%).
| Demographics | Rating | Rank | Female Unemployment |
| Immigrants | Portugal | 0.2 /100 | #258 | Tragic 5.8% |
| Immigrants | Fiji | 0.2 /100 | #259 | Tragic 5.8% |
| Nigerians | 0.2 /100 | #260 | Tragic 5.8% |
| Kiowa | 0.1 /100 | #261 | Tragic 5.8% |
| Immigrants | Nigeria | 0.1 /100 | #262 | Tragic 5.8% |
| Immigrants | Azores | 0.1 /100 | #263 | Tragic 5.8% |
| Immigrants | Bahamas | 0.1 /100 | #264 | Tragic 5.8% |
| Blackfeet | 0.0 /100 | #265 | Tragic 5.9% |
| Cape Verdeans | 0.0 /100 | #266 | Tragic 5.9% |
| Nepalese | 0.0 /100 | #267 | Tragic 5.9% |
| Hondurans | 0.0 /100 | #268 | Tragic 5.9% |
| Immigrants | Western Africa | 0.0 /100 | #269 | Tragic 5.9% |
| Immigrants | Honduras | 0.0 /100 | #270 | Tragic 5.9% |
| Central Americans | 0.0 /100 | #271 | Tragic 5.9% |
| Lumbee | 0.0 /100 | #272 | Tragic 5.9% |
Demographics Similar to Latvians by Female Unemployment
In terms of female unemployment, the demographic groups most similar to Latvians are Polish (4.7%, a difference of 0.010%), Bulgarian (4.7%, a difference of 0.090%), Fijian (4.7%, a difference of 0.10%), European (4.7%, a difference of 0.12%), and Croatian (4.7%, a difference of 0.14%).
| Demographics | Rating | Rank | Female Unemployment |
| Scandinavians | 100.0 /100 | #11 | Exceptional 4.6% |
| Dutch | 100.0 /100 | #12 | Exceptional 4.6% |
| Belgians | 100.0 /100 | #13 | Exceptional 4.6% |
| Finns | 100.0 /100 | #14 | Exceptional 4.6% |
| English | 100.0 /100 | #15 | Exceptional 4.6% |
| Carpatho Rusyns | 99.9 /100 | #16 | Exceptional 4.7% |
| Croatians | 99.9 /100 | #17 | Exceptional 4.7% |
| Latvians | 99.9 /100 | #18 | Exceptional 4.7% |
| Poles | 99.9 /100 | #19 | Exceptional 4.7% |
| Bulgarians | 99.9 /100 | #20 | Exceptional 4.7% |
| Fijians | 99.9 /100 | #21 | Exceptional 4.7% |
| Europeans | 99.9 /100 | #22 | Exceptional 4.7% |
| Scottish | 99.9 /100 | #23 | Exceptional 4.7% |
| Welsh | 99.9 /100 | #24 | Exceptional 4.7% |
| Immigrants | India | 99.9 /100 | #25 | Exceptional 4.7% |