Bermudan vs Yaqui Male Unemployment
COMPARE
Bermudan
Yaqui
Male Unemployment
Male Unemployment Comparison
Bermudans
Yaqui
5.9%
MALE UNEMPLOYMENT
0.0/ 100
METRIC RATING
268th/ 347
METRIC RANK
5.7%
MALE UNEMPLOYMENT
0.7/ 100
METRIC RATING
245th/ 347
METRIC RANK
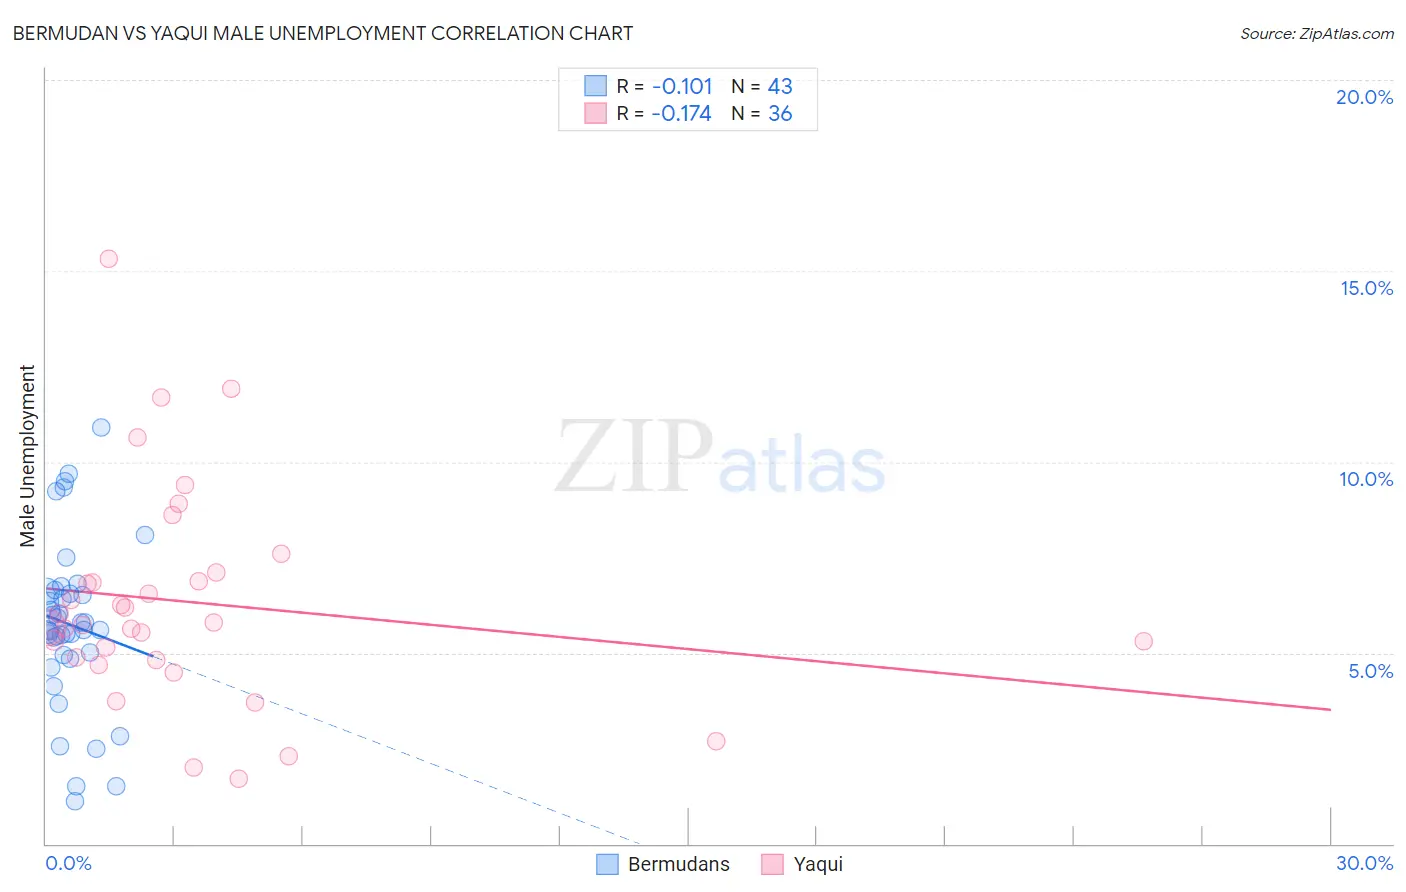
Bermudan vs Yaqui Male Unemployment Correlation Chart
The statistical analysis conducted on geographies consisting of 55,661,801 people shows a poor negative correlation between the proportion of Bermudans and unemployment rate among males in the United States with a correlation coefficient (R) of -0.101 and weighted average of 5.9%. Similarly, the statistical analysis conducted on geographies consisting of 107,561,387 people shows a poor negative correlation between the proportion of Yaqui and unemployment rate among males in the United States with a correlation coefficient (R) of -0.174 and weighted average of 5.7%, a difference of 4.5%.
Male Unemployment Correlation Summary
| Measurement | Bermudan | Yaqui |
| Minimum | 1.1% | 1.7% |
| Maximum | 10.9% | 15.3% |
| Range | 9.8% | 13.6% |
| Mean | 5.7% | 6.3% |
| Median | 5.6% | 5.8% |
| Interquartile 25% (IQ1) | 4.9% | 4.8% |
| Interquartile 75% (IQ3) | 6.6% | 7.0% |
| Interquartile Range (IQR) | 1.7% | 2.1% |
| Standard Deviation (Sample) | 2.1% | 2.8% |
| Standard Deviation (Population) | 2.1% | 2.8% |
Similar Demographics by Male Unemployment
Demographics Similar to Bermudans by Male Unemployment
In terms of male unemployment, the demographic groups most similar to Bermudans are Nigerian (5.9%, a difference of 0.21%), Immigrants from Nigeria (6.0%, a difference of 0.27%), Bahamian (5.9%, a difference of 0.33%), Subsaharan African (6.0%, a difference of 0.40%), and French American Indian (5.9%, a difference of 0.47%).
| Demographics | Rating | Rank | Male Unemployment |
| Liberians | 0.1 /100 | #261 | Tragic 5.8% |
| Immigrants | Portugal | 0.1 /100 | #262 | Tragic 5.9% |
| Immigrants | Latin America | 0.1 /100 | #263 | Tragic 5.9% |
| Immigrants | Mexico | 0.0 /100 | #264 | Tragic 5.9% |
| French American Indians | 0.0 /100 | #265 | Tragic 5.9% |
| Bahamians | 0.0 /100 | #266 | Tragic 5.9% |
| Nigerians | 0.0 /100 | #267 | Tragic 5.9% |
| Bermudans | 0.0 /100 | #268 | Tragic 5.9% |
| Immigrants | Nigeria | 0.0 /100 | #269 | Tragic 6.0% |
| Sub-Saharan Africans | 0.0 /100 | #270 | Tragic 6.0% |
| Blackfeet | 0.0 /100 | #271 | Tragic 6.0% |
| Immigrants | Uzbekistan | 0.0 /100 | #272 | Tragic 6.0% |
| Armenians | 0.0 /100 | #273 | Tragic 6.0% |
| Immigrants | Sierra Leone | 0.0 /100 | #274 | Tragic 6.0% |
| Menominee | 0.0 /100 | #275 | Tragic 6.0% |
Demographics Similar to Yaqui by Male Unemployment
In terms of male unemployment, the demographic groups most similar to Yaqui are Iroquois (5.7%, a difference of 0.090%), Immigrants from El Salvador (5.7%, a difference of 0.17%), Hawaiian (5.7%, a difference of 0.19%), Bangladeshi (5.7%, a difference of 0.21%), and Ottawa (5.7%, a difference of 0.50%).
| Demographics | Rating | Rank | Male Unemployment |
| Native Hawaiians | 1.1 /100 | #238 | Tragic 5.6% |
| Immigrants | Guatemala | 1.1 /100 | #239 | Tragic 5.6% |
| Immigrants | Cameroon | 1.0 /100 | #240 | Tragic 5.6% |
| Salvadorans | 1.0 /100 | #241 | Tragic 5.7% |
| Ottawa | 0.9 /100 | #242 | Tragic 5.7% |
| Bangladeshis | 0.8 /100 | #243 | Tragic 5.7% |
| Immigrants | El Salvador | 0.7 /100 | #244 | Tragic 5.7% |
| Yaqui | 0.7 /100 | #245 | Tragic 5.7% |
| Iroquois | 0.6 /100 | #246 | Tragic 5.7% |
| Hawaiians | 0.6 /100 | #247 | Tragic 5.7% |
| Marshallese | 0.5 /100 | #248 | Tragic 5.7% |
| Cree | 0.4 /100 | #249 | Tragic 5.7% |
| Immigrants | Bahamas | 0.4 /100 | #250 | Tragic 5.7% |
| Spanish Americans | 0.3 /100 | #251 | Tragic 5.7% |
| Mexicans | 0.2 /100 | #252 | Tragic 5.8% |