Bermudan vs Yaqui Unemployment Among Women with Children Under 18 years
COMPARE
Bermudan
Yaqui
Unemployment Among Women with Children Under 18 years
Unemployment Among Women with Children Under 18 years Comparison
Bermudans
Yaqui
6.1%
UNEMPLOYMENT AMONG WOMEN WITH CHILDREN UNDER 18 YEARS
0.1/ 100
METRIC RATING
257th/ 347
METRIC RANK
6.6%
UNEMPLOYMENT AMONG WOMEN WITH CHILDREN UNDER 18 YEARS
0.0/ 100
METRIC RATING
311th/ 347
METRIC RANK
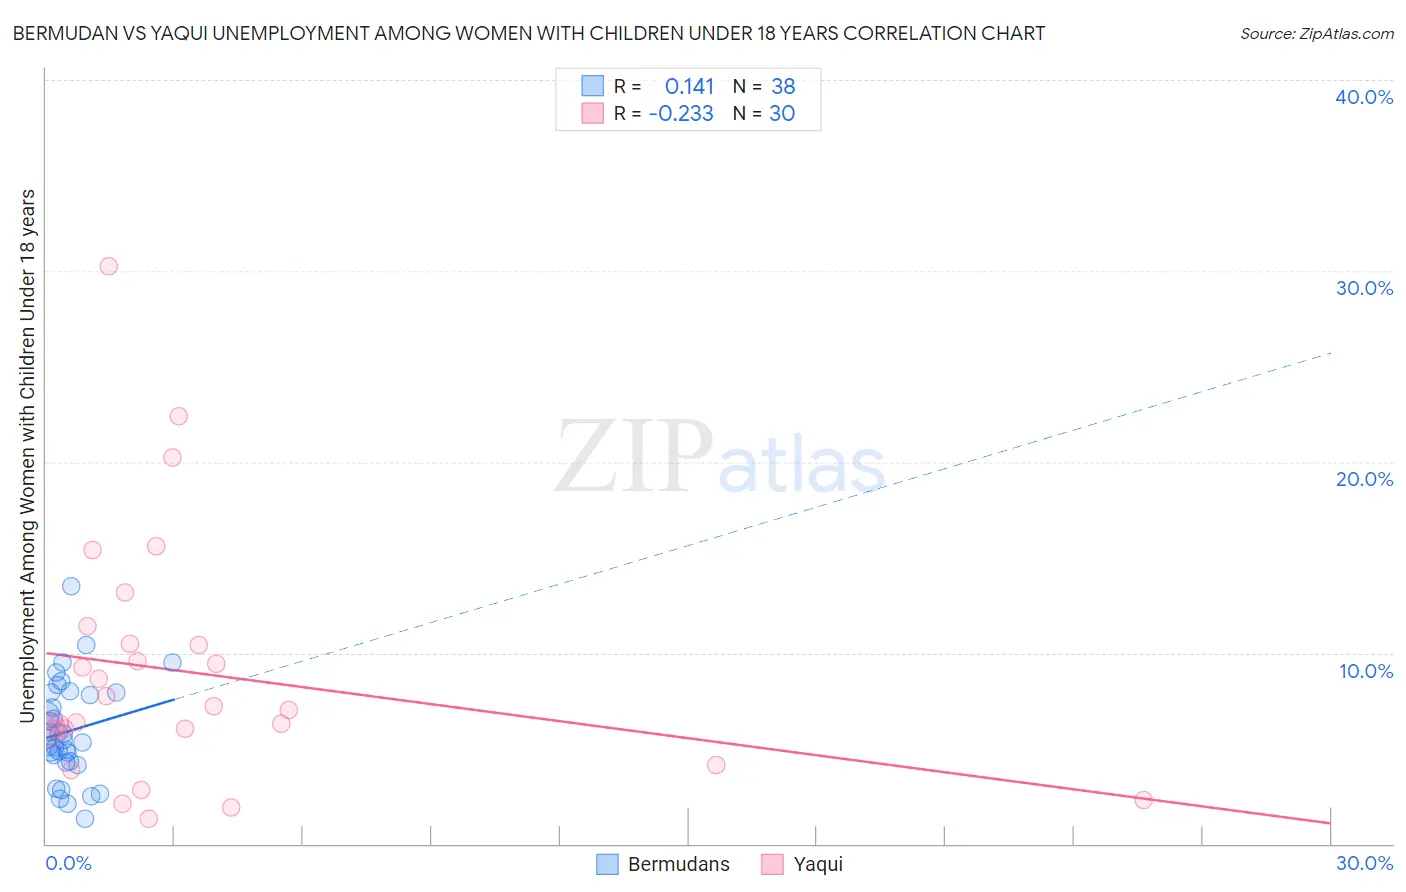
Bermudan vs Yaqui Unemployment Among Women with Children Under 18 years Correlation Chart
The statistical analysis conducted on geographies consisting of 55,293,080 people shows a poor positive correlation between the proportion of Bermudans and unemployment rate among women with children under the age of 18 in the United States with a correlation coefficient (R) of 0.141 and weighted average of 6.1%. Similarly, the statistical analysis conducted on geographies consisting of 106,498,893 people shows a weak negative correlation between the proportion of Yaqui and unemployment rate among women with children under the age of 18 in the United States with a correlation coefficient (R) of -0.233 and weighted average of 6.6%, a difference of 8.3%.
Unemployment Among Women with Children Under 18 years Correlation Summary
| Measurement | Bermudan | Yaqui |
| Minimum | 1.3% | 1.3% |
| Maximum | 13.5% | 30.2% |
| Range | 12.2% | 28.9% |
| Mean | 5.9% | 9.0% |
| Median | 5.5% | 7.1% |
| Interquartile 25% (IQ1) | 4.3% | 5.9% |
| Interquartile 75% (IQ3) | 7.9% | 10.5% |
| Interquartile Range (IQR) | 3.6% | 4.6% |
| Standard Deviation (Sample) | 2.6% | 6.5% |
| Standard Deviation (Population) | 2.6% | 6.4% |
Similar Demographics by Unemployment Among Women with Children Under 18 years
Demographics Similar to Bermudans by Unemployment Among Women with Children Under 18 years
In terms of unemployment among women with children under 18 years, the demographic groups most similar to Bermudans are Immigrants from Nigeria (6.1%, a difference of 0.19%), Nepalese (6.0%, a difference of 0.53%), Liberian (6.0%, a difference of 0.61%), Ottawa (6.1%, a difference of 0.86%), and Nigerian (6.1%, a difference of 0.88%).
| Demographics | Rating | Rank | Unemployment Among Women with Children Under 18 years |
| Immigrants | Cabo Verde | 0.7 /100 | #250 | Tragic 5.9% |
| Ute | 0.7 /100 | #251 | Tragic 5.9% |
| Seminole | 0.5 /100 | #252 | Tragic 6.0% |
| Immigrants | Congo | 0.4 /100 | #253 | Tragic 6.0% |
| Immigrants | Azores | 0.3 /100 | #254 | Tragic 6.0% |
| Liberians | 0.2 /100 | #255 | Tragic 6.0% |
| Nepalese | 0.2 /100 | #256 | Tragic 6.0% |
| Bermudans | 0.1 /100 | #257 | Tragic 6.1% |
| Immigrants | Nigeria | 0.1 /100 | #258 | Tragic 6.1% |
| Ottawa | 0.1 /100 | #259 | Tragic 6.1% |
| Nigerians | 0.1 /100 | #260 | Tragic 6.1% |
| Immigrants | Liberia | 0.1 /100 | #261 | Tragic 6.1% |
| Immigrants | Trinidad and Tobago | 0.1 /100 | #262 | Tragic 6.1% |
| Spanish American Indians | 0.1 /100 | #263 | Tragic 6.1% |
| Comanche | 0.1 /100 | #264 | Tragic 6.1% |
Demographics Similar to Yaqui by Unemployment Among Women with Children Under 18 years
In terms of unemployment among women with children under 18 years, the demographic groups most similar to Yaqui are Immigrants from Mexico (6.6%, a difference of 0.090%), Guyanese (6.6%, a difference of 0.30%), Hispanic or Latino (6.6%, a difference of 0.38%), British West Indian (6.6%, a difference of 0.52%), and Immigrants from West Indies (6.6%, a difference of 0.52%).
| Demographics | Rating | Rank | Unemployment Among Women with Children Under 18 years |
| Vietnamese | 0.0 /100 | #304 | Tragic 6.5% |
| Immigrants | Central America | 0.0 /100 | #305 | Tragic 6.5% |
| Immigrants | Guyana | 0.0 /100 | #306 | Tragic 6.5% |
| Belizeans | 0.0 /100 | #307 | Tragic 6.5% |
| Africans | 0.0 /100 | #308 | Tragic 6.5% |
| Ecuadorians | 0.0 /100 | #309 | Tragic 6.5% |
| Guyanese | 0.0 /100 | #310 | Tragic 6.6% |
| Yaqui | 0.0 /100 | #311 | Tragic 6.6% |
| Immigrants | Mexico | 0.0 /100 | #312 | Tragic 6.6% |
| Hispanics or Latinos | 0.0 /100 | #313 | Tragic 6.6% |
| British West Indians | 0.0 /100 | #314 | Tragic 6.6% |
| Immigrants | West Indies | 0.0 /100 | #315 | Tragic 6.6% |
| Immigrants | Ecuador | 0.0 /100 | #316 | Tragic 6.6% |
| Shoshone | 0.0 /100 | #317 | Tragic 6.6% |
| Alaska Natives | 0.0 /100 | #318 | Tragic 6.7% |