Cuban vs Yaqui Male Unemployment
COMPARE
Cuban
Yaqui
Male Unemployment
Male Unemployment Comparison
Cubans
Yaqui
4.6%
MALE UNEMPLOYMENT
100.0/ 100
METRIC RATING
10th/ 347
METRIC RANK
5.7%
MALE UNEMPLOYMENT
0.7/ 100
METRIC RATING
245th/ 347
METRIC RANK
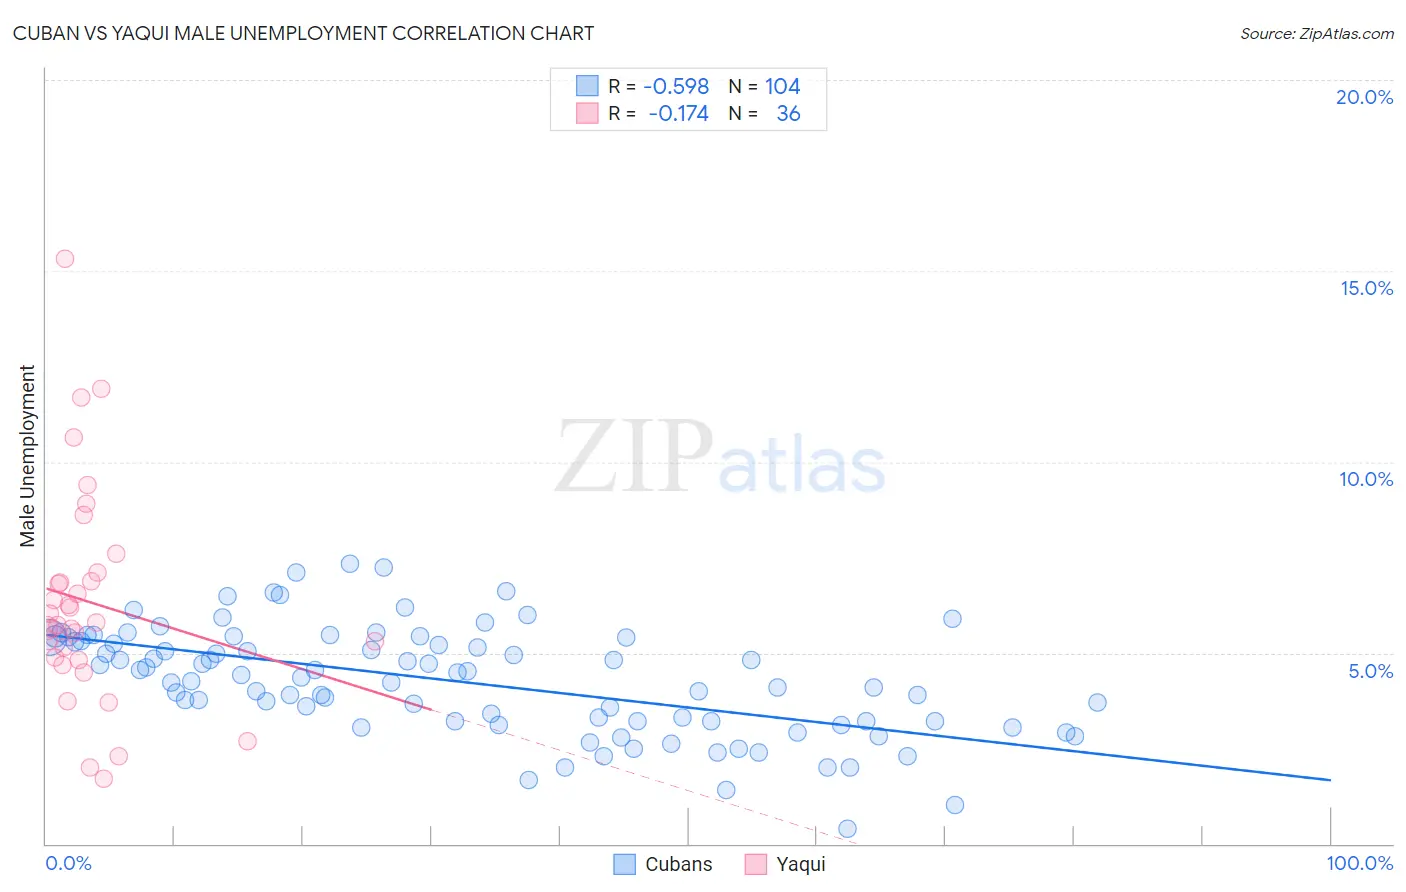
Cuban vs Yaqui Male Unemployment Correlation Chart
The statistical analysis conducted on geographies consisting of 447,036,033 people shows a substantial negative correlation between the proportion of Cubans and unemployment rate among males in the United States with a correlation coefficient (R) of -0.598 and weighted average of 4.6%. Similarly, the statistical analysis conducted on geographies consisting of 107,561,387 people shows a poor negative correlation between the proportion of Yaqui and unemployment rate among males in the United States with a correlation coefficient (R) of -0.174 and weighted average of 5.7%, a difference of 23.1%.
Male Unemployment Correlation Summary
| Measurement | Cuban | Yaqui |
| Minimum | 0.40% | 1.7% |
| Maximum | 7.3% | 15.3% |
| Range | 6.9% | 13.6% |
| Mean | 4.3% | 6.3% |
| Median | 4.4% | 5.8% |
| Interquartile 25% (IQ1) | 3.2% | 4.8% |
| Interquartile 75% (IQ3) | 5.4% | 7.0% |
| Interquartile Range (IQR) | 2.2% | 2.1% |
| Standard Deviation (Sample) | 1.4% | 2.8% |
| Standard Deviation (Population) | 1.4% | 2.8% |
Similar Demographics by Male Unemployment
Demographics Similar to Cubans by Male Unemployment
In terms of male unemployment, the demographic groups most similar to Cubans are Swedish (4.6%, a difference of 0.20%), Thai (4.6%, a difference of 0.60%), Immigrants from Bolivia (4.7%, a difference of 0.93%), Bolivian (4.7%, a difference of 1.6%), and German (4.7%, a difference of 1.6%).
| Demographics | Rating | Rank | Male Unemployment |
| Norwegians | 100.0 /100 | #3 | Exceptional 4.4% |
| Immigrants | Venezuela | 100.0 /100 | #4 | Exceptional 4.4% |
| Danes | 100.0 /100 | #5 | Exceptional 4.5% |
| Venezuelans | 100.0 /100 | #6 | Exceptional 4.5% |
| Czechs | 100.0 /100 | #7 | Exceptional 4.5% |
| Luxembourgers | 100.0 /100 | #8 | Exceptional 4.5% |
| Thais | 100.0 /100 | #9 | Exceptional 4.6% |
| Cubans | 100.0 /100 | #10 | Exceptional 4.6% |
| Swedes | 100.0 /100 | #11 | Exceptional 4.6% |
| Immigrants | Bolivia | 100.0 /100 | #12 | Exceptional 4.7% |
| Bolivians | 100.0 /100 | #13 | Exceptional 4.7% |
| Germans | 100.0 /100 | #14 | Exceptional 4.7% |
| Scandinavians | 100.0 /100 | #15 | Exceptional 4.7% |
| Swiss | 99.9 /100 | #16 | Exceptional 4.7% |
| Filipinos | 99.9 /100 | #17 | Exceptional 4.7% |
Demographics Similar to Yaqui by Male Unemployment
In terms of male unemployment, the demographic groups most similar to Yaqui are Iroquois (5.7%, a difference of 0.090%), Immigrants from El Salvador (5.7%, a difference of 0.17%), Hawaiian (5.7%, a difference of 0.19%), Bangladeshi (5.7%, a difference of 0.21%), and Ottawa (5.7%, a difference of 0.50%).
| Demographics | Rating | Rank | Male Unemployment |
| Native Hawaiians | 1.1 /100 | #238 | Tragic 5.6% |
| Immigrants | Guatemala | 1.1 /100 | #239 | Tragic 5.6% |
| Immigrants | Cameroon | 1.0 /100 | #240 | Tragic 5.6% |
| Salvadorans | 1.0 /100 | #241 | Tragic 5.7% |
| Ottawa | 0.9 /100 | #242 | Tragic 5.7% |
| Bangladeshis | 0.8 /100 | #243 | Tragic 5.7% |
| Immigrants | El Salvador | 0.7 /100 | #244 | Tragic 5.7% |
| Yaqui | 0.7 /100 | #245 | Tragic 5.7% |
| Iroquois | 0.6 /100 | #246 | Tragic 5.7% |
| Hawaiians | 0.6 /100 | #247 | Tragic 5.7% |
| Marshallese | 0.5 /100 | #248 | Tragic 5.7% |
| Cree | 0.4 /100 | #249 | Tragic 5.7% |
| Immigrants | Bahamas | 0.4 /100 | #250 | Tragic 5.7% |
| Spanish Americans | 0.3 /100 | #251 | Tragic 5.7% |
| Mexicans | 0.2 /100 | #252 | Tragic 5.8% |