Bermudan vs Immigrants from the Azores Male Unemployment
COMPARE
Bermudan
Immigrants from the Azores
Male Unemployment
Male Unemployment Comparison
Bermudans
Immigrants from the Azores
5.9%
MALE UNEMPLOYMENT
0.0/ 100
METRIC RATING
268th/ 347
METRIC RANK
6.4%
MALE UNEMPLOYMENT
0.0/ 100
METRIC RATING
291st/ 347
METRIC RANK
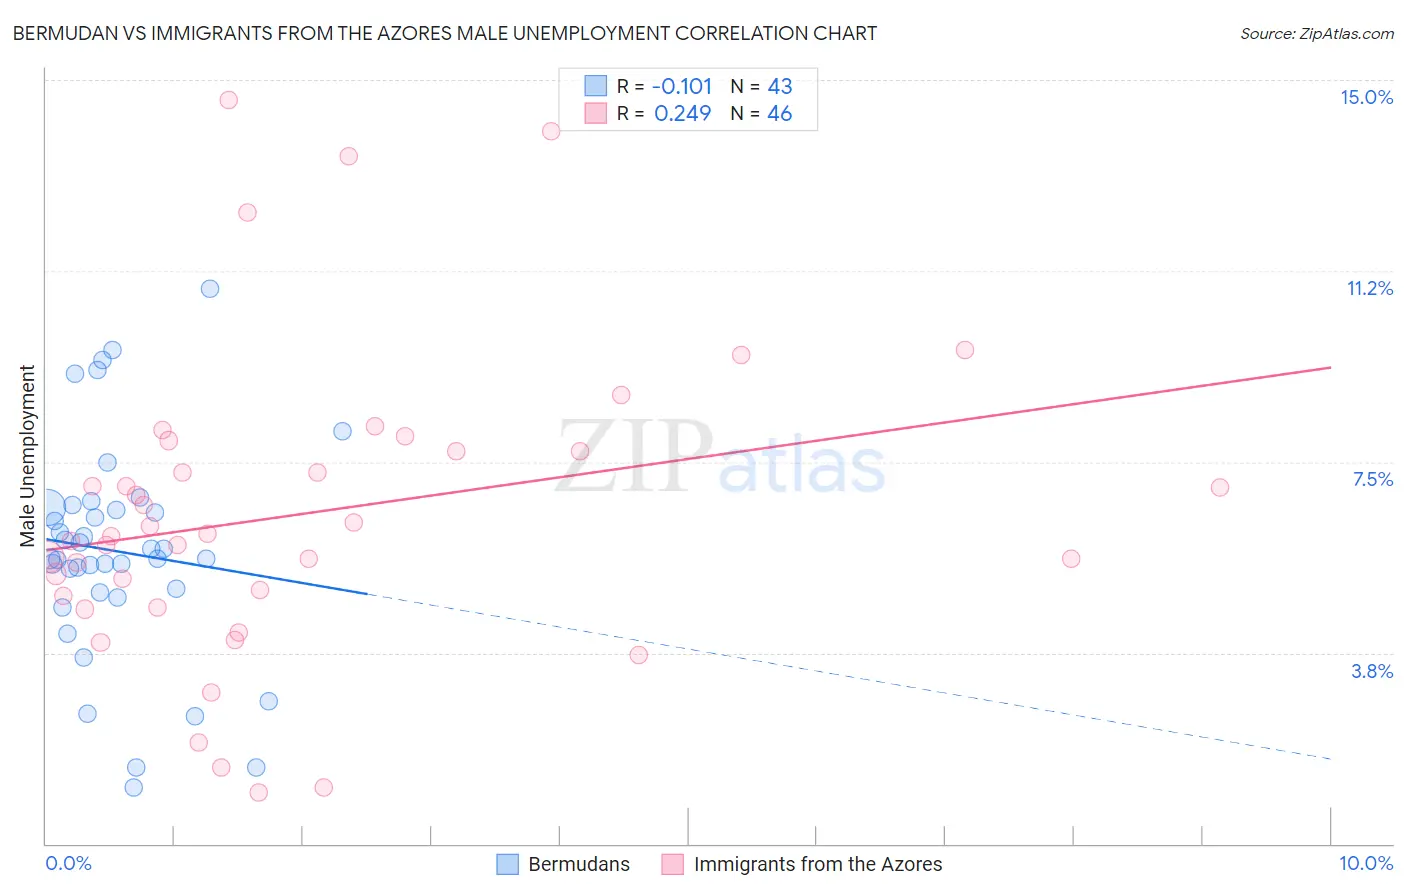
Bermudan vs Immigrants from the Azores Male Unemployment Correlation Chart
The statistical analysis conducted on geographies consisting of 55,661,801 people shows a poor negative correlation between the proportion of Bermudans and unemployment rate among males in the United States with a correlation coefficient (R) of -0.101 and weighted average of 5.9%. Similarly, the statistical analysis conducted on geographies consisting of 46,221,475 people shows a weak positive correlation between the proportion of Immigrants from the Azores and unemployment rate among males in the United States with a correlation coefficient (R) of 0.249 and weighted average of 6.4%, a difference of 8.1%.
Male Unemployment Correlation Summary
| Measurement | Bermudan | Immigrants from the Azores |
| Minimum | 1.1% | 1.0% |
| Maximum | 10.9% | 14.6% |
| Range | 9.8% | 13.6% |
| Mean | 5.7% | 6.5% |
| Median | 5.6% | 6.1% |
| Interquartile 25% (IQ1) | 4.9% | 4.9% |
| Interquartile 75% (IQ3) | 6.6% | 7.7% |
| Interquartile Range (IQR) | 1.7% | 2.8% |
| Standard Deviation (Sample) | 2.1% | 3.0% |
| Standard Deviation (Population) | 2.1% | 3.0% |
Similar Demographics by Male Unemployment
Demographics Similar to Bermudans by Male Unemployment
In terms of male unemployment, the demographic groups most similar to Bermudans are Nigerian (5.9%, a difference of 0.21%), Immigrants from Nigeria (6.0%, a difference of 0.27%), Bahamian (5.9%, a difference of 0.33%), Subsaharan African (6.0%, a difference of 0.40%), and French American Indian (5.9%, a difference of 0.47%).
| Demographics | Rating | Rank | Male Unemployment |
| Liberians | 0.1 /100 | #261 | Tragic 5.8% |
| Immigrants | Portugal | 0.1 /100 | #262 | Tragic 5.9% |
| Immigrants | Latin America | 0.1 /100 | #263 | Tragic 5.9% |
| Immigrants | Mexico | 0.0 /100 | #264 | Tragic 5.9% |
| French American Indians | 0.0 /100 | #265 | Tragic 5.9% |
| Bahamians | 0.0 /100 | #266 | Tragic 5.9% |
| Nigerians | 0.0 /100 | #267 | Tragic 5.9% |
| Bermudans | 0.0 /100 | #268 | Tragic 5.9% |
| Immigrants | Nigeria | 0.0 /100 | #269 | Tragic 6.0% |
| Sub-Saharan Africans | 0.0 /100 | #270 | Tragic 6.0% |
| Blackfeet | 0.0 /100 | #271 | Tragic 6.0% |
| Immigrants | Uzbekistan | 0.0 /100 | #272 | Tragic 6.0% |
| Armenians | 0.0 /100 | #273 | Tragic 6.0% |
| Immigrants | Sierra Leone | 0.0 /100 | #274 | Tragic 6.0% |
| Menominee | 0.0 /100 | #275 | Tragic 6.0% |
Demographics Similar to Immigrants from the Azores by Male Unemployment
In terms of male unemployment, the demographic groups most similar to Immigrants from the Azores are Nepalese (6.4%, a difference of 0.34%), Haitian (6.4%, a difference of 0.38%), Senegalese (6.4%, a difference of 0.48%), U.S. Virgin Islander (6.4%, a difference of 0.52%), and Belizean (6.5%, a difference of 1.3%).
| Demographics | Rating | Rank | Male Unemployment |
| Spanish American Indians | 0.0 /100 | #284 | Tragic 6.2% |
| Immigrants | Ecuador | 0.0 /100 | #285 | Tragic 6.2% |
| Africans | 0.0 /100 | #286 | Tragic 6.3% |
| Central American Indians | 0.0 /100 | #287 | Tragic 6.3% |
| Immigrants | Senegal | 0.0 /100 | #288 | Tragic 6.3% |
| Immigrants | Caribbean | 0.0 /100 | #289 | Tragic 6.3% |
| U.S. Virgin Islanders | 0.0 /100 | #290 | Tragic 6.4% |
| Immigrants | Azores | 0.0 /100 | #291 | Tragic 6.4% |
| Nepalese | 0.0 /100 | #292 | Tragic 6.4% |
| Haitians | 0.0 /100 | #293 | Tragic 6.4% |
| Senegalese | 0.0 /100 | #294 | Tragic 6.4% |
| Belizeans | 0.0 /100 | #295 | Tragic 6.5% |
| Immigrants | Haiti | 0.0 /100 | #296 | Tragic 6.5% |
| Chippewa | 0.0 /100 | #297 | Tragic 6.6% |
| Jamaicans | 0.0 /100 | #298 | Tragic 6.6% |