Immigrants from Panama vs Dutch West Indian Female Unemployment
COMPARE
Immigrants from Panama
Dutch West Indian
Female Unemployment
Female Unemployment Comparison
Immigrants from Panama
Dutch West Indians
5.5%
FEMALE UNEMPLOYMENT
3.2/ 100
METRIC RATING
237th/ 347
METRIC RANK
5.7%
FEMALE UNEMPLOYMENT
0.3/ 100
METRIC RATING
257th/ 347
METRIC RANK
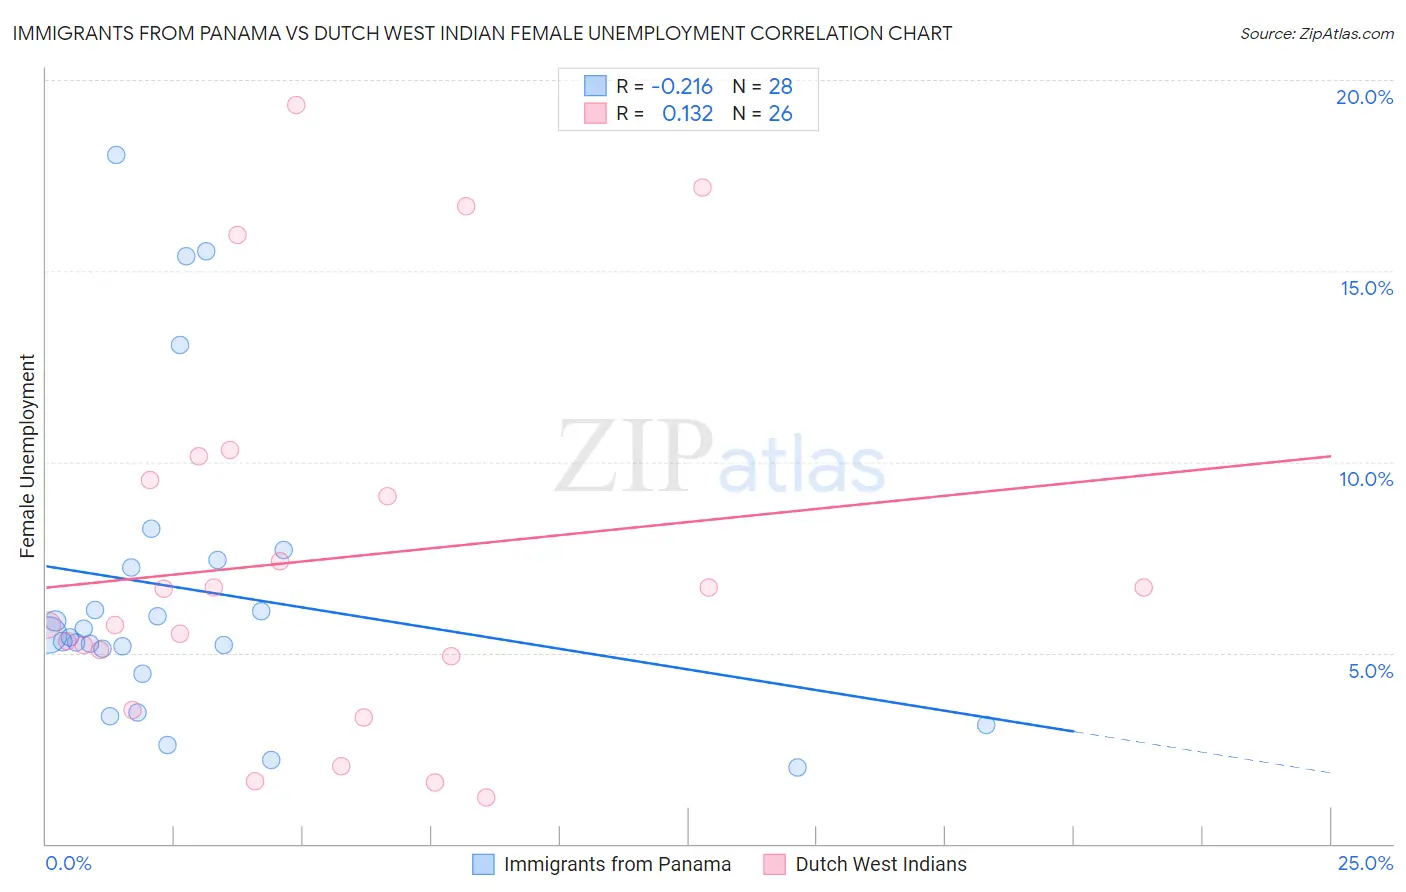
Immigrants from Panama vs Dutch West Indian Female Unemployment Correlation Chart
The statistical analysis conducted on geographies consisting of 220,928,919 people shows a weak negative correlation between the proportion of Immigrants from Panama and unemploymnet rate among females in the United States with a correlation coefficient (R) of -0.216 and weighted average of 5.5%. Similarly, the statistical analysis conducted on geographies consisting of 85,478,446 people shows a poor positive correlation between the proportion of Dutch West Indians and unemploymnet rate among females in the United States with a correlation coefficient (R) of 0.132 and weighted average of 5.7%, a difference of 3.2%.
Female Unemployment Correlation Summary
| Measurement | Immigrants from Panama | Dutch West Indian |
| Minimum | 2.0% | 1.2% |
| Maximum | 18.0% | 19.3% |
| Range | 16.0% | 18.1% |
| Mean | 6.6% | 7.4% |
| Median | 5.4% | 6.2% |
| Interquartile 25% (IQ1) | 4.8% | 4.9% |
| Interquartile 75% (IQ3) | 7.3% | 9.5% |
| Interquartile Range (IQR) | 2.6% | 4.6% |
| Standard Deviation (Sample) | 4.1% | 5.0% |
| Standard Deviation (Population) | 4.0% | 4.9% |
Demographics Similar to Immigrants from Panama and Dutch West Indians by Female Unemployment
In terms of female unemployment, the demographic groups most similar to Immigrants from Panama are Sierra Leonean (5.5%, a difference of 0.020%), Aleut (5.5%, a difference of 0.12%), Immigrants from South America (5.5%, a difference of 0.16%), South American Indian (5.5%, a difference of 0.20%), and Marshallese (5.6%, a difference of 0.52%). Similarly, the demographic groups most similar to Dutch West Indians are Subsaharan African (5.7%, a difference of 0.070%), Immigrants from Cameroon (5.7%, a difference of 0.74%), Immigrants from Sierra Leone (5.7%, a difference of 0.78%), Immigrants (5.7%, a difference of 0.78%), and Cajun (5.7%, a difference of 0.92%).
| Demographics | Rating | Rank | Female Unemployment |
| Immigrants | Panama | 3.2 /100 | #237 | Tragic 5.5% |
| Sierra Leoneans | 3.2 /100 | #238 | Tragic 5.5% |
| Aleuts | 3.0 /100 | #239 | Tragic 5.5% |
| Immigrants | South America | 2.9 /100 | #240 | Tragic 5.5% |
| South American Indians | 2.8 /100 | #241 | Tragic 5.5% |
| Marshallese | 2.3 /100 | #242 | Tragic 5.6% |
| Spanish Americans | 2.2 /100 | #243 | Tragic 5.6% |
| Immigrants | Liberia | 1.5 /100 | #244 | Tragic 5.6% |
| Guamanians/Chamorros | 1.4 /100 | #245 | Tragic 5.6% |
| Japanese | 1.2 /100 | #246 | Tragic 5.6% |
| Immigrants | Western Asia | 1.1 /100 | #247 | Tragic 5.6% |
| Cree | 1.0 /100 | #248 | Tragic 5.6% |
| Immigrants | Uzbekistan | 1.0 /100 | #249 | Tragic 5.6% |
| Immigrants | Syria | 0.8 /100 | #250 | Tragic 5.6% |
| Assyrians/Chaldeans/Syriacs | 0.8 /100 | #251 | Tragic 5.6% |
| Cajuns | 0.7 /100 | #252 | Tragic 5.7% |
| Immigrants | Sierra Leone | 0.6 /100 | #253 | Tragic 5.7% |
| Immigrants | Immigrants | 0.6 /100 | #254 | Tragic 5.7% |
| Immigrants | Cameroon | 0.6 /100 | #255 | Tragic 5.7% |
| Sub-Saharan Africans | 0.4 /100 | #256 | Tragic 5.7% |
| Dutch West Indians | 0.3 /100 | #257 | Tragic 5.7% |