Basque vs Yaqui Unemployment
COMPARE
Basque
Yaqui
Unemployment
Unemployment Comparison
Basques
Yaqui
5.0%
UNEMPLOYMENT
97.6/ 100
METRIC RATING
81st/ 347
METRIC RANK
5.8%
UNEMPLOYMENT
0.2/ 100
METRIC RATING
257th/ 347
METRIC RANK
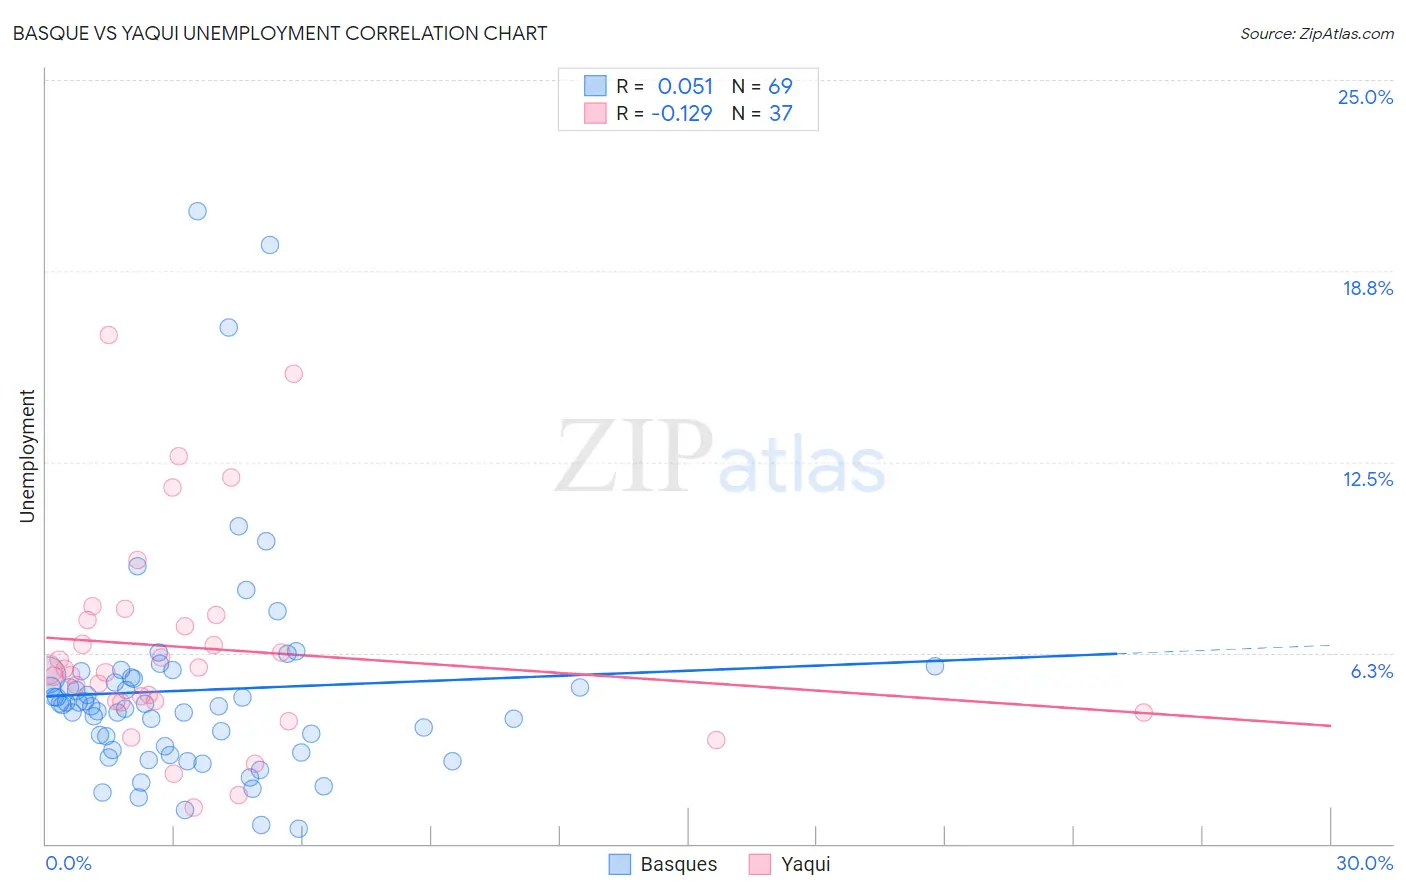
Basque vs Yaqui Unemployment Correlation Chart
The statistical analysis conducted on geographies consisting of 165,724,344 people shows a slight positive correlation between the proportion of Basques and unemployment in the United States with a correlation coefficient (R) of 0.051 and weighted average of 5.0%. Similarly, the statistical analysis conducted on geographies consisting of 107,699,810 people shows a poor negative correlation between the proportion of Yaqui and unemployment in the United States with a correlation coefficient (R) of -0.129 and weighted average of 5.8%, a difference of 16.5%.
Unemployment Correlation Summary
| Measurement | Basque | Yaqui |
| Minimum | 0.50% | 1.2% |
| Maximum | 20.7% | 16.6% |
| Range | 20.2% | 15.4% |
| Mean | 5.0% | 6.4% |
| Median | 4.5% | 5.7% |
| Interquartile 25% (IQ1) | 3.0% | 4.6% |
| Interquartile 75% (IQ3) | 5.5% | 7.4% |
| Interquartile Range (IQR) | 2.5% | 2.8% |
| Standard Deviation (Sample) | 3.6% | 3.5% |
| Standard Deviation (Population) | 3.6% | 3.4% |
Similar Demographics by Unemployment
Demographics Similar to Basques by Unemployment
In terms of unemployment, the demographic groups most similar to Basques are Immigrants from Sweden (5.0%, a difference of 0.010%), Fijian (5.0%, a difference of 0.010%), Hmong (5.0%, a difference of 0.020%), Canadian (5.0%, a difference of 0.080%), and Russian (5.0%, a difference of 0.10%).
| Demographics | Rating | Rank | Unemployment |
| Immigrants | Northern Europe | 98.2 /100 | #74 | Exceptional 4.9% |
| Turks | 98.0 /100 | #75 | Exceptional 4.9% |
| German Russians | 98.0 /100 | #76 | Exceptional 4.9% |
| Cypriots | 97.9 /100 | #77 | Exceptional 4.9% |
| Okinawans | 97.9 /100 | #78 | Exceptional 4.9% |
| Canadians | 97.7 /100 | #79 | Exceptional 5.0% |
| Immigrants | Sweden | 97.6 /100 | #80 | Exceptional 5.0% |
| Basques | 97.6 /100 | #81 | Exceptional 5.0% |
| Fijians | 97.6 /100 | #82 | Exceptional 5.0% |
| Hmong | 97.6 /100 | #83 | Exceptional 5.0% |
| Russians | 97.4 /100 | #84 | Exceptional 5.0% |
| Immigrants | Australia | 97.0 /100 | #85 | Exceptional 5.0% |
| Hungarians | 96.9 /100 | #86 | Exceptional 5.0% |
| Immigrants | Moldova | 96.6 /100 | #87 | Exceptional 5.0% |
| Immigrants | Korea | 96.6 /100 | #88 | Exceptional 5.0% |
Demographics Similar to Yaqui by Unemployment
In terms of unemployment, the demographic groups most similar to Yaqui are Immigrants from Bahamas (5.8%, a difference of 0.14%), Subsaharan African (5.8%, a difference of 0.26%), Immigrants from Uzbekistan (5.8%, a difference of 0.28%), Guatemalan (5.8%, a difference of 0.30%), and Immigrants from Guatemala (5.8%, a difference of 0.30%).
| Demographics | Rating | Rank | Unemployment |
| Japanese | 0.8 /100 | #250 | Tragic 5.6% |
| Kiowa | 0.6 /100 | #251 | Tragic 5.7% |
| Hondurans | 0.3 /100 | #252 | Tragic 5.7% |
| Central Americans | 0.3 /100 | #253 | Tragic 5.7% |
| Immigrants | Honduras | 0.3 /100 | #254 | Tragic 5.7% |
| Immigrants | Portugal | 0.2 /100 | #255 | Tragic 5.7% |
| Guatemalans | 0.2 /100 | #256 | Tragic 5.8% |
| Yaqui | 0.2 /100 | #257 | Tragic 5.8% |
| Immigrants | Bahamas | 0.1 /100 | #258 | Tragic 5.8% |
| Sub-Saharan Africans | 0.1 /100 | #259 | Tragic 5.8% |
| Immigrants | Uzbekistan | 0.1 /100 | #260 | Tragic 5.8% |
| Immigrants | Guatemala | 0.1 /100 | #261 | Tragic 5.8% |
| Sierra Leoneans | 0.1 /100 | #262 | Tragic 5.8% |
| Salvadorans | 0.1 /100 | #263 | Tragic 5.8% |
| Immigrants | Liberia | 0.1 /100 | #264 | Tragic 5.8% |