Basque vs Immigrants from France Unemployment
COMPARE
Basque
Immigrants from France
Unemployment
Unemployment Comparison
Basques
Immigrants from France
5.0%
UNEMPLOYMENT
97.6/ 100
METRIC RATING
81st/ 347
METRIC RANK
5.1%
UNEMPLOYMENT
89.7/ 100
METRIC RATING
119th/ 347
METRIC RANK
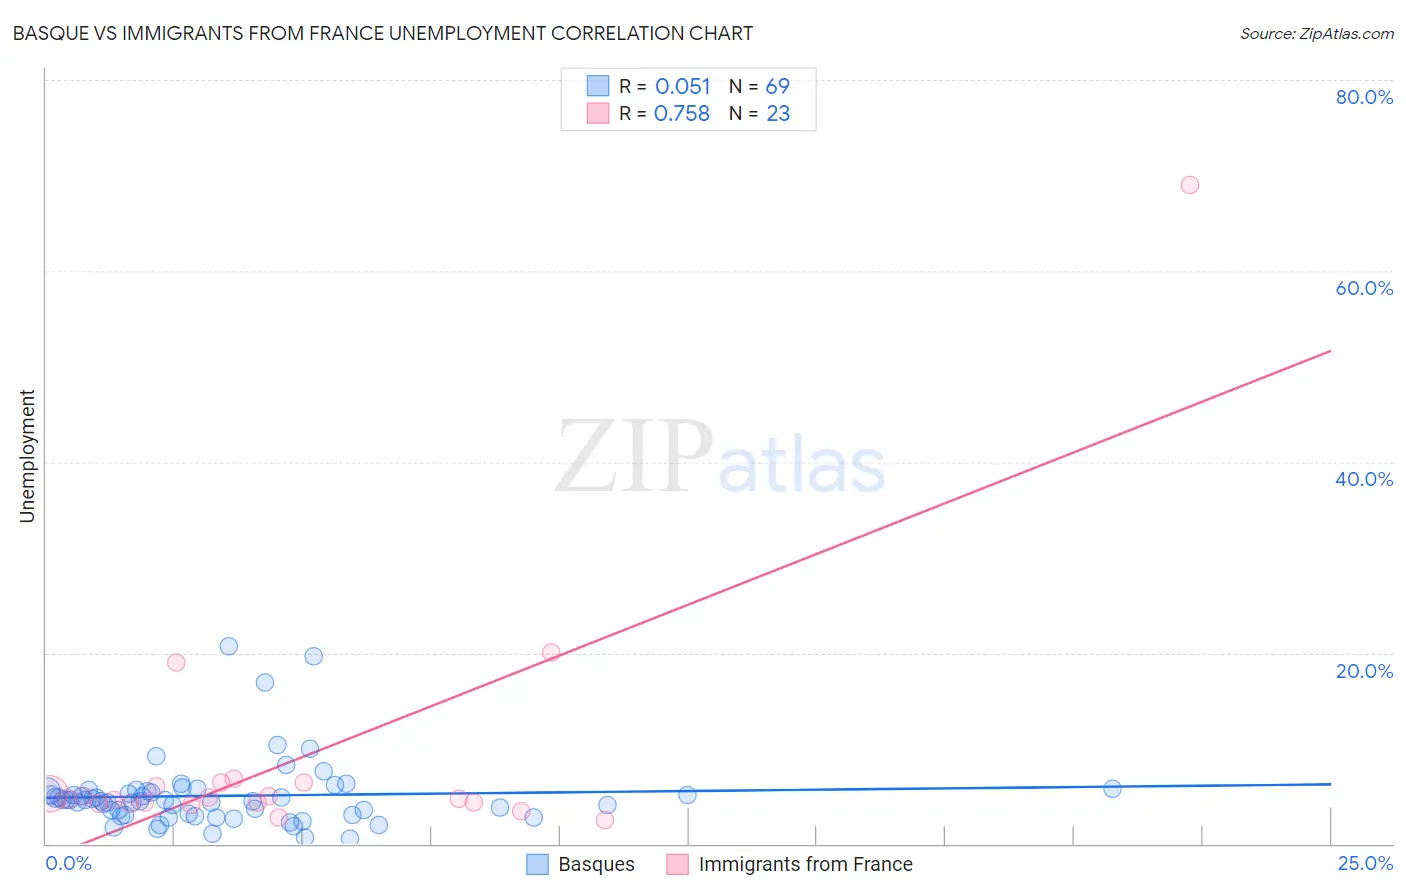
Basque vs Immigrants from France Unemployment Correlation Chart
The statistical analysis conducted on geographies consisting of 165,724,344 people shows a slight positive correlation between the proportion of Basques and unemployment in the United States with a correlation coefficient (R) of 0.051 and weighted average of 5.0%. Similarly, the statistical analysis conducted on geographies consisting of 287,750,590 people shows a strong positive correlation between the proportion of Immigrants from France and unemployment in the United States with a correlation coefficient (R) of 0.758 and weighted average of 5.1%, a difference of 2.5%.
Unemployment Correlation Summary
| Measurement | Basque | Immigrants from France |
| Minimum | 0.50% | 2.5% |
| Maximum | 20.7% | 69.0% |
| Range | 20.2% | 66.5% |
| Mean | 5.0% | 8.8% |
| Median | 4.5% | 4.7% |
| Interquartile 25% (IQ1) | 3.0% | 4.2% |
| Interquartile 75% (IQ3) | 5.5% | 6.4% |
| Interquartile Range (IQR) | 2.5% | 2.2% |
| Standard Deviation (Sample) | 3.6% | 13.8% |
| Standard Deviation (Population) | 3.6% | 13.5% |
Similar Demographics by Unemployment
Demographics Similar to Basques by Unemployment
In terms of unemployment, the demographic groups most similar to Basques are Immigrants from Sweden (5.0%, a difference of 0.010%), Fijian (5.0%, a difference of 0.010%), Hmong (5.0%, a difference of 0.020%), Canadian (5.0%, a difference of 0.080%), and Russian (5.0%, a difference of 0.10%).
| Demographics | Rating | Rank | Unemployment |
| Immigrants | Northern Europe | 98.2 /100 | #74 | Exceptional 4.9% |
| Turks | 98.0 /100 | #75 | Exceptional 4.9% |
| German Russians | 98.0 /100 | #76 | Exceptional 4.9% |
| Cypriots | 97.9 /100 | #77 | Exceptional 4.9% |
| Okinawans | 97.9 /100 | #78 | Exceptional 4.9% |
| Canadians | 97.7 /100 | #79 | Exceptional 5.0% |
| Immigrants | Sweden | 97.6 /100 | #80 | Exceptional 5.0% |
| Basques | 97.6 /100 | #81 | Exceptional 5.0% |
| Fijians | 97.6 /100 | #82 | Exceptional 5.0% |
| Hmong | 97.6 /100 | #83 | Exceptional 5.0% |
| Russians | 97.4 /100 | #84 | Exceptional 5.0% |
| Immigrants | Australia | 97.0 /100 | #85 | Exceptional 5.0% |
| Hungarians | 96.9 /100 | #86 | Exceptional 5.0% |
| Immigrants | Moldova | 96.6 /100 | #87 | Exceptional 5.0% |
| Immigrants | Korea | 96.6 /100 | #88 | Exceptional 5.0% |
Demographics Similar to Immigrants from France by Unemployment
In terms of unemployment, the demographic groups most similar to Immigrants from France are Macedonian (5.1%, a difference of 0.010%), Lebanese (5.1%, a difference of 0.080%), Immigrants from Switzerland (5.1%, a difference of 0.090%), Asian (5.1%, a difference of 0.12%), and Ethiopian (5.1%, a difference of 0.17%).
| Demographics | Rating | Rank | Unemployment |
| South Africans | 92.6 /100 | #112 | Exceptional 5.1% |
| Argentineans | 92.4 /100 | #113 | Exceptional 5.1% |
| Immigrants | Ireland | 92.1 /100 | #114 | Exceptional 5.1% |
| Immigrants | Western Europe | 91.1 /100 | #115 | Exceptional 5.1% |
| Immigrants | Sri Lanka | 91.1 /100 | #116 | Exceptional 5.1% |
| Immigrants | Malaysia | 91.0 /100 | #117 | Exceptional 5.1% |
| Immigrants | Germany | 90.8 /100 | #118 | Exceptional 5.1% |
| Immigrants | France | 89.7 /100 | #119 | Excellent 5.1% |
| Macedonians | 89.7 /100 | #120 | Excellent 5.1% |
| Lebanese | 89.2 /100 | #121 | Excellent 5.1% |
| Immigrants | Switzerland | 89.1 /100 | #122 | Excellent 5.1% |
| Asians | 89.0 /100 | #123 | Excellent 5.1% |
| Ethiopians | 88.6 /100 | #124 | Excellent 5.1% |
| Immigrants | Eastern Asia | 88.3 /100 | #125 | Excellent 5.1% |
| Kenyans | 88.2 /100 | #126 | Excellent 5.1% |