Bangladeshi vs Immigrants from Chile 9th Grade
COMPARE
Bangladeshi
Immigrants from Chile
9th Grade
9th Grade Comparison
Bangladeshis
Immigrants from Chile
93.4%
9TH GRADE
0.0/ 100
METRIC RATING
284th/ 347
METRIC RANK
94.5%
9TH GRADE
13.4/ 100
METRIC RATING
210th/ 347
METRIC RANK
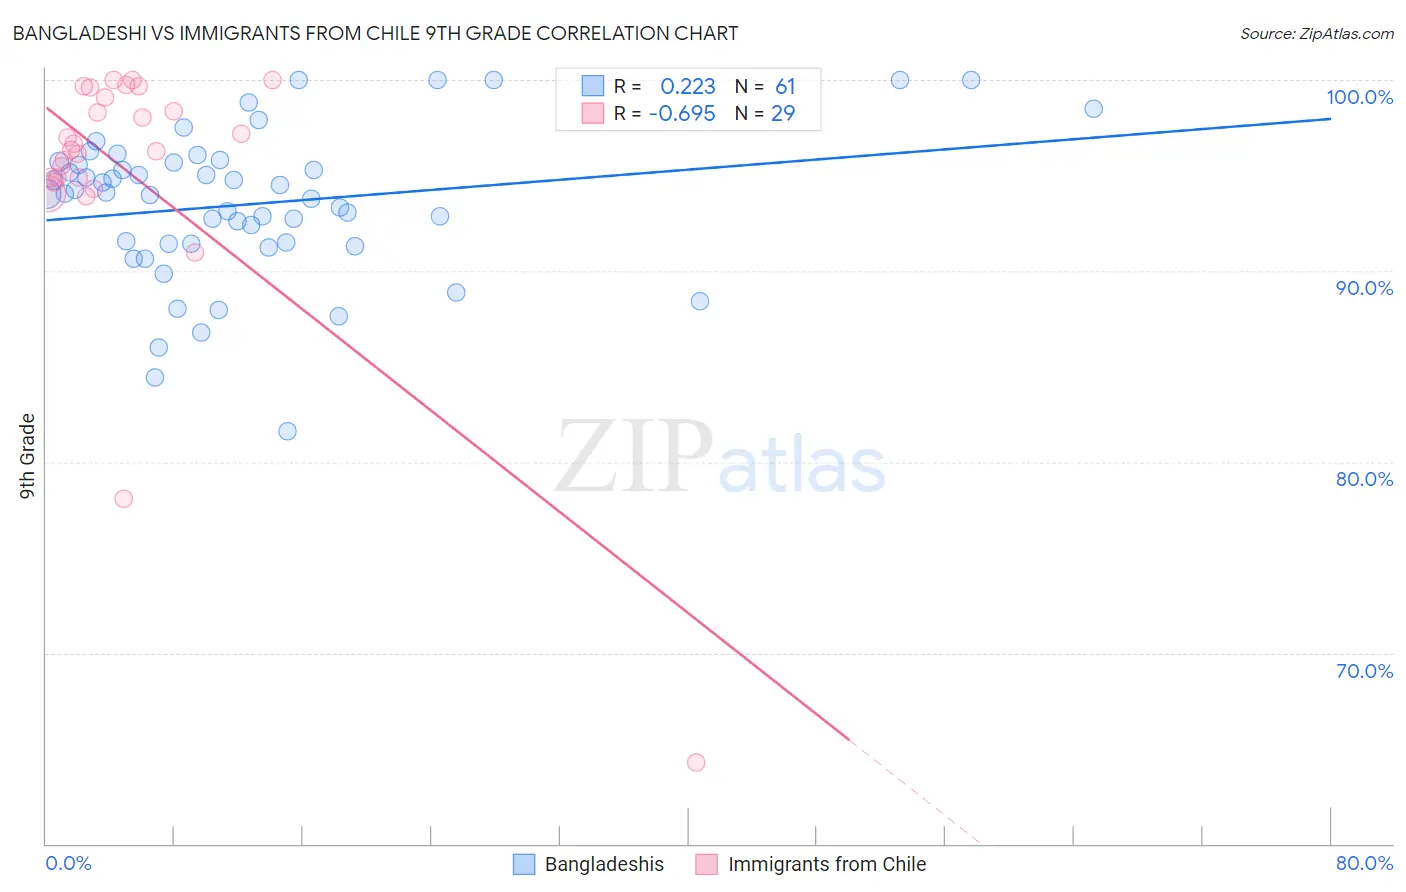
Bangladeshi vs Immigrants from Chile 9th Grade Correlation Chart
The statistical analysis conducted on geographies consisting of 141,430,495 people shows a weak positive correlation between the proportion of Bangladeshis and percentage of population with at least 9th grade education in the United States with a correlation coefficient (R) of 0.223 and weighted average of 93.4%. Similarly, the statistical analysis conducted on geographies consisting of 218,647,266 people shows a significant negative correlation between the proportion of Immigrants from Chile and percentage of population with at least 9th grade education in the United States with a correlation coefficient (R) of -0.695 and weighted average of 94.5%, a difference of 1.2%.
9th Grade Correlation Summary
| Measurement | Bangladeshi | Immigrants from Chile |
| Minimum | 81.6% | 64.3% |
| Maximum | 100.0% | 100.0% |
| Range | 18.4% | 35.7% |
| Mean | 93.5% | 95.1% |
| Median | 94.1% | 96.3% |
| Interquartile 25% (IQ1) | 91.4% | 94.8% |
| Interquartile 75% (IQ3) | 95.7% | 99.4% |
| Interquartile Range (IQR) | 4.3% | 4.6% |
| Standard Deviation (Sample) | 3.9% | 7.3% |
| Standard Deviation (Population) | 3.8% | 7.1% |
Similar Demographics by 9th Grade
Demographics Similar to Bangladeshis by 9th Grade
In terms of 9th grade, the demographic groups most similar to Bangladeshis are Immigrants from Peru (93.4%, a difference of 0.040%), Barbadian (93.5%, a difference of 0.070%), Malaysian (93.5%, a difference of 0.080%), Immigrants from Barbados (93.4%, a difference of 0.080%), and Immigrants from St. Vincent and the Grenadines (93.4%, a difference of 0.090%).
| Demographics | Rating | Rank | 9th Grade |
| Immigrants | Philippines | 0.1 /100 | #277 | Tragic 93.7% |
| Immigrants | Eritrea | 0.1 /100 | #278 | Tragic 93.7% |
| Trinidadians and Tobagonians | 0.1 /100 | #279 | Tragic 93.7% |
| Taiwanese | 0.1 /100 | #280 | Tragic 93.6% |
| Immigrants | Trinidad and Tobago | 0.1 /100 | #281 | Tragic 93.6% |
| Malaysians | 0.0 /100 | #282 | Tragic 93.5% |
| Barbadians | 0.0 /100 | #283 | Tragic 93.5% |
| Bangladeshis | 0.0 /100 | #284 | Tragic 93.4% |
| Immigrants | Peru | 0.0 /100 | #285 | Tragic 93.4% |
| Immigrants | Barbados | 0.0 /100 | #286 | Tragic 93.4% |
| Immigrants | St. Vincent and the Grenadines | 0.0 /100 | #287 | Tragic 93.4% |
| Immigrants | South Eastern Asia | 0.0 /100 | #288 | Tragic 93.3% |
| Immigrants | West Indies | 0.0 /100 | #289 | Tragic 93.3% |
| Pennsylvania Germans | 0.0 /100 | #290 | Tragic 93.3% |
| British West Indians | 0.0 /100 | #291 | Tragic 93.2% |
Demographics Similar to Immigrants from Chile by 9th Grade
In terms of 9th grade, the demographic groups most similar to Immigrants from Chile are Comanche (94.6%, a difference of 0.020%), Immigrants from Indonesia (94.5%, a difference of 0.020%), Immigrants from Malaysia (94.5%, a difference of 0.020%), Immigrants from Oceania (94.5%, a difference of 0.020%), and Immigrants from Pakistan (94.6%, a difference of 0.030%).
| Demographics | Rating | Rank | 9th Grade |
| Immigrants | Bahamas | 19.8 /100 | #203 | Poor 94.6% |
| Moroccans | 19.6 /100 | #204 | Poor 94.6% |
| Immigrants | Sudan | 17.6 /100 | #205 | Poor 94.6% |
| Samoans | 17.3 /100 | #206 | Poor 94.6% |
| Immigrants | Morocco | 16.3 /100 | #207 | Poor 94.6% |
| Immigrants | Pakistan | 15.5 /100 | #208 | Poor 94.6% |
| Comanche | 14.9 /100 | #209 | Poor 94.6% |
| Immigrants | Chile | 13.4 /100 | #210 | Poor 94.5% |
| Immigrants | Indonesia | 12.3 /100 | #211 | Poor 94.5% |
| Immigrants | Malaysia | 12.2 /100 | #212 | Poor 94.5% |
| Immigrants | Oceania | 12.1 /100 | #213 | Poor 94.5% |
| Immigrants | Liberia | 11.8 /100 | #214 | Poor 94.5% |
| Immigrants | Syria | 11.0 /100 | #215 | Poor 94.5% |
| Immigrants | Western Asia | 10.7 /100 | #216 | Poor 94.5% |
| Asians | 9.9 /100 | #217 | Tragic 94.5% |