Burmese vs Immigrants from Burma/Myanmar Unemployment Among Ages 30 to 34 years
COMPARE
Burmese
Immigrants from Burma/Myanmar
Unemployment Among Ages 30 to 34 years
Unemployment Among Ages 30 to 34 years Comparison
Burmese
Immigrants from Burma/Myanmar
5.1%
UNEMPLOYMENT AMONG AGES 30 TO 34 YEARS
96.5/ 100
METRIC RATING
67th/ 347
METRIC RANK
5.1%
UNEMPLOYMENT AMONG AGES 30 TO 34 YEARS
98.1/ 100
METRIC RATING
52nd/ 347
METRIC RANK
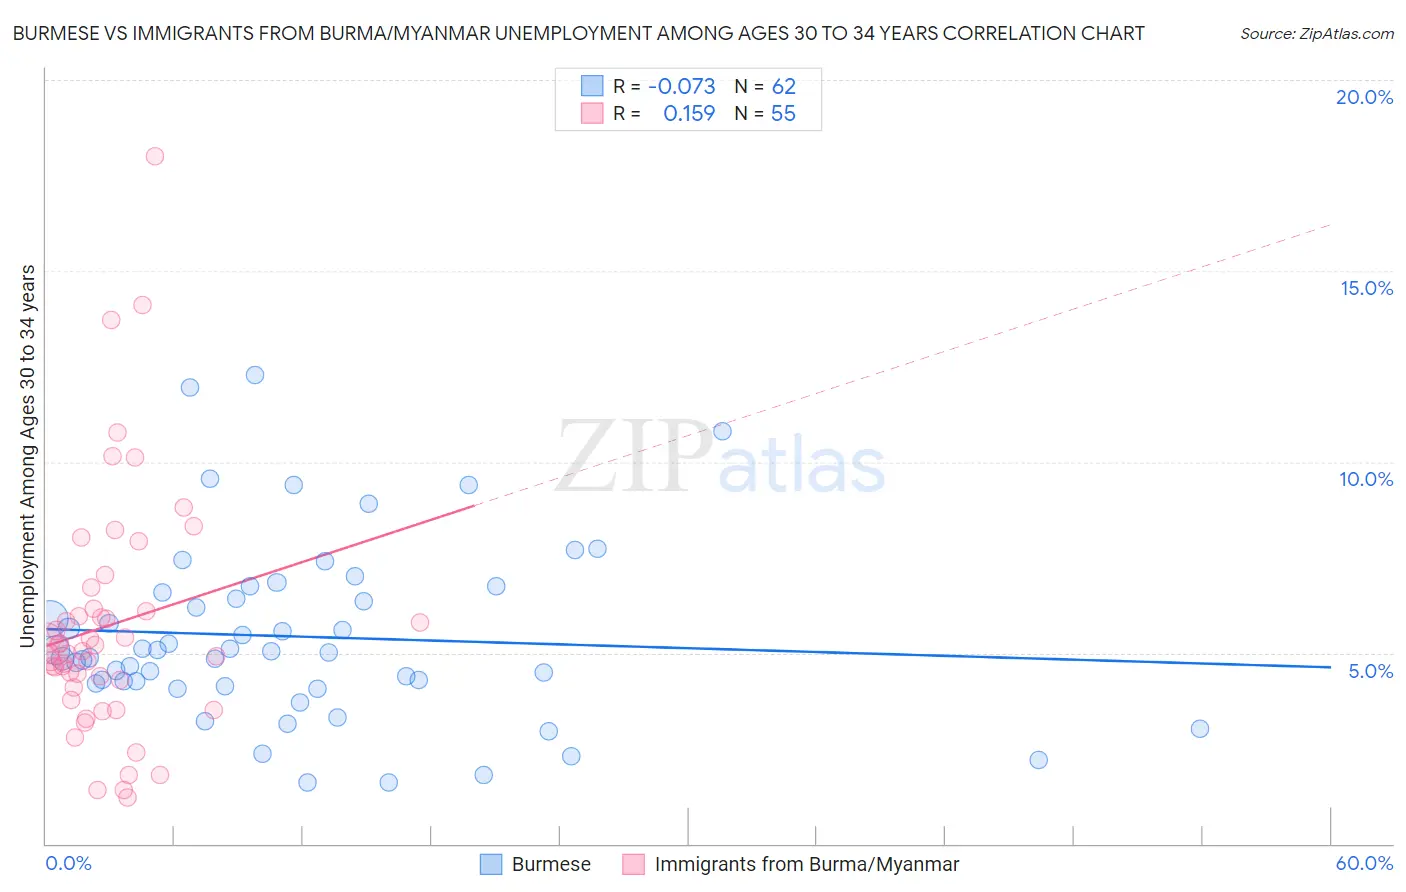
Burmese vs Immigrants from Burma/Myanmar Unemployment Among Ages 30 to 34 years Correlation Chart
The statistical analysis conducted on geographies consisting of 431,223,716 people shows a slight negative correlation between the proportion of Burmese and unemployment rate among population between the ages 30 and 34 in the United States with a correlation coefficient (R) of -0.073 and weighted average of 5.1%. Similarly, the statistical analysis conducted on geographies consisting of 168,858,886 people shows a poor positive correlation between the proportion of Immigrants from Burma/Myanmar and unemployment rate among population between the ages 30 and 34 in the United States with a correlation coefficient (R) of 0.159 and weighted average of 5.1%, a difference of 1.2%.
Unemployment Among Ages 30 to 34 years Correlation Summary
| Measurement | Burmese | Immigrants from Burma/Myanmar |
| Minimum | 1.6% | 1.2% |
| Maximum | 12.3% | 18.0% |
| Range | 10.7% | 16.8% |
| Mean | 5.4% | 5.7% |
| Median | 5.0% | 5.0% |
| Interquartile 25% (IQ1) | 4.2% | 4.1% |
| Interquartile 75% (IQ3) | 6.6% | 6.2% |
| Interquartile Range (IQR) | 2.4% | 2.1% |
| Standard Deviation (Sample) | 2.3% | 3.2% |
| Standard Deviation (Population) | 2.3% | 3.1% |
Demographics Similar to Burmese and Immigrants from Burma/Myanmar by Unemployment Among Ages 30 to 34 years
In terms of unemployment among ages 30 to 34 years, the demographic groups most similar to Burmese are Jordanian (5.1%, a difference of 0.010%), Immigrants from Northern Africa (5.1%, a difference of 0.020%), Immigrants from Zimbabwe (5.1%, a difference of 0.13%), Immigrants from Japan (5.1%, a difference of 0.20%), and Immigrants from Eastern Asia (5.1%, a difference of 0.27%). Similarly, the demographic groups most similar to Immigrants from Burma/Myanmar are Turkish (5.1%, a difference of 0.040%), Cuban (5.1%, a difference of 0.050%), Puget Sound Salish (5.1%, a difference of 0.070%), Immigrants from Malaysia (5.1%, a difference of 0.14%), and Immigrants from Morocco (5.1%, a difference of 0.23%).
| Demographics | Rating | Rank | Unemployment Among Ages 30 to 34 years |
| Immigrants | Malaysia | 98.3 /100 | #49 | Exceptional 5.1% |
| Puget Sound Salish | 98.2 /100 | #50 | Exceptional 5.1% |
| Turks | 98.2 /100 | #51 | Exceptional 5.1% |
| Immigrants | Burma/Myanmar | 98.1 /100 | #52 | Exceptional 5.1% |
| Cubans | 98.1 /100 | #53 | Exceptional 5.1% |
| Immigrants | Morocco | 97.9 /100 | #54 | Exceptional 5.1% |
| Chinese | 97.7 /100 | #55 | Exceptional 5.1% |
| Immigrants | Serbia | 97.4 /100 | #56 | Exceptional 5.1% |
| Immigrants | China | 97.2 /100 | #57 | Exceptional 5.1% |
| Asians | 97.2 /100 | #58 | Exceptional 5.1% |
| Swedes | 97.1 /100 | #59 | Exceptional 5.1% |
| Immigrants | Somalia | 97.1 /100 | #60 | Exceptional 5.1% |
| Indians (Asian) | 97.0 /100 | #61 | Exceptional 5.1% |
| Immigrants | France | 97.0 /100 | #62 | Exceptional 5.1% |
| Belgians | 97.0 /100 | #63 | Exceptional 5.1% |
| Immigrants | Eastern Asia | 96.9 /100 | #64 | Exceptional 5.1% |
| Immigrants | Japan | 96.8 /100 | #65 | Exceptional 5.1% |
| Immigrants | Zimbabwe | 96.7 /100 | #66 | Exceptional 5.1% |
| Burmese | 96.5 /100 | #67 | Exceptional 5.1% |
| Jordanians | 96.5 /100 | #68 | Exceptional 5.1% |
| Immigrants | Northern Africa | 96.4 /100 | #69 | Exceptional 5.1% |