Austrian vs Vietnamese Unemployment Among Ages 30 to 34 years
COMPARE
Austrian
Vietnamese
Unemployment Among Ages 30 to 34 years
Unemployment Among Ages 30 to 34 years Comparison
Austrians
Vietnamese
5.4%
UNEMPLOYMENT AMONG AGES 30 TO 34 YEARS
59.0/ 100
METRIC RATING
161st/ 347
METRIC RANK
6.5%
UNEMPLOYMENT AMONG AGES 30 TO 34 YEARS
0.0/ 100
METRIC RATING
292nd/ 347
METRIC RANK
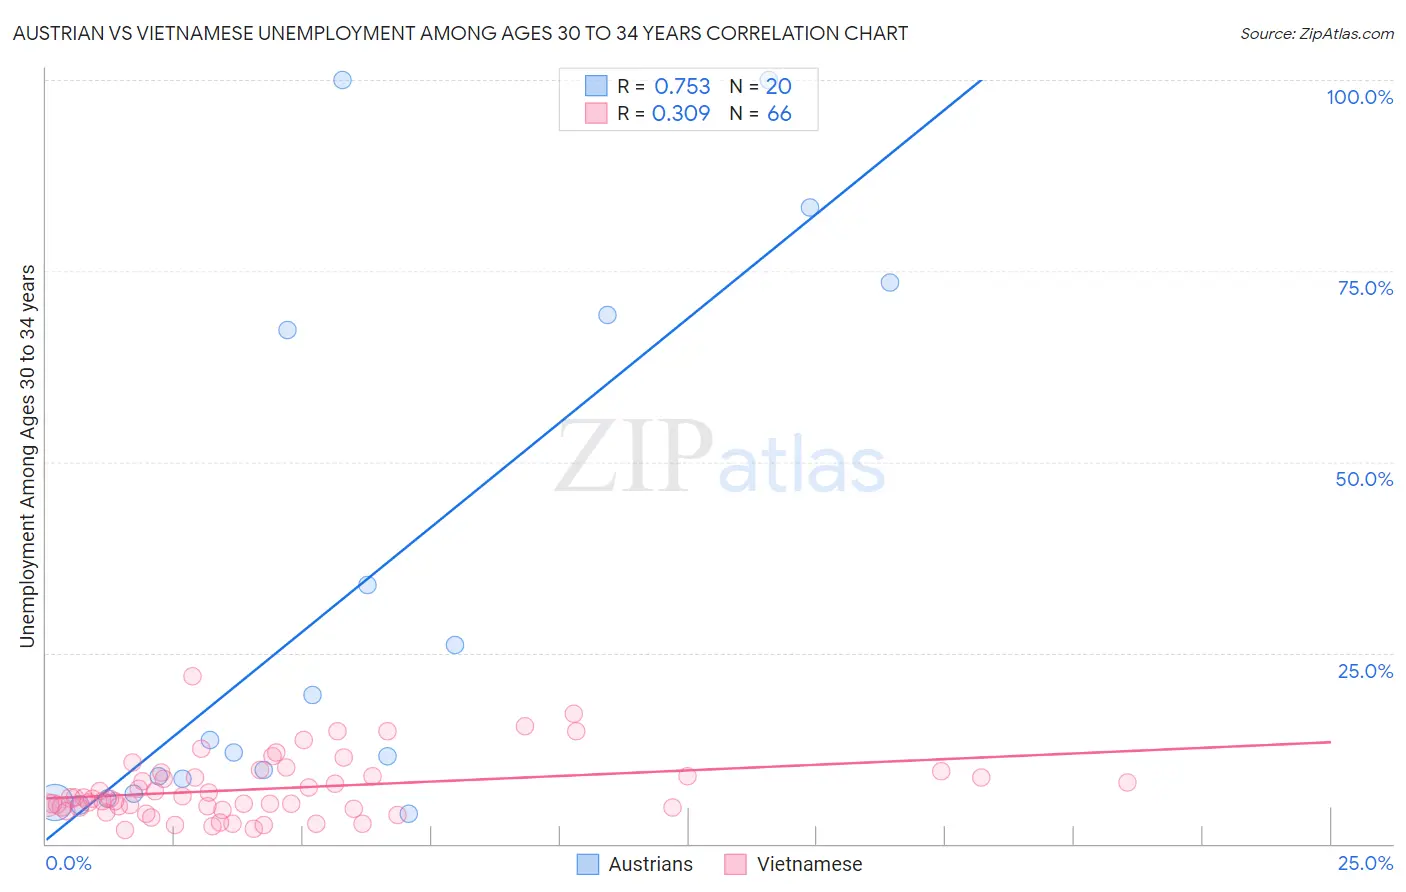
Austrian vs Vietnamese Unemployment Among Ages 30 to 34 years Correlation Chart
The statistical analysis conducted on geographies consisting of 414,053,097 people shows a strong positive correlation between the proportion of Austrians and unemployment rate among population between the ages 30 and 34 in the United States with a correlation coefficient (R) of 0.753 and weighted average of 5.4%. Similarly, the statistical analysis conducted on geographies consisting of 167,594,884 people shows a mild positive correlation between the proportion of Vietnamese and unemployment rate among population between the ages 30 and 34 in the United States with a correlation coefficient (R) of 0.309 and weighted average of 6.5%, a difference of 19.7%.
Unemployment Among Ages 30 to 34 years Correlation Summary
| Measurement | Austrian | Vietnamese |
| Minimum | 3.9% | 1.8% |
| Maximum | 100.0% | 22.0% |
| Range | 96.1% | 20.2% |
| Mean | 33.2% | 7.2% |
| Median | 12.8% | 5.9% |
| Interquartile 25% (IQ1) | 7.5% | 4.7% |
| Interquartile 75% (IQ3) | 68.2% | 8.9% |
| Interquartile Range (IQR) | 60.7% | 4.2% |
| Standard Deviation (Sample) | 34.6% | 4.1% |
| Standard Deviation (Population) | 33.7% | 4.0% |
Similar Demographics by Unemployment Among Ages 30 to 34 years
Demographics Similar to Austrians by Unemployment Among Ages 30 to 34 years
In terms of unemployment among ages 30 to 34 years, the demographic groups most similar to Austrians are Immigrants from Scotland (5.4%, a difference of 0.020%), Brazilian (5.4%, a difference of 0.050%), Arab (5.4%, a difference of 0.090%), Basque (5.4%, a difference of 0.12%), and Immigrants from Croatia (5.4%, a difference of 0.15%).
| Demographics | Rating | Rank | Unemployment Among Ages 30 to 34 years |
| South Africans | 66.5 /100 | #154 | Good 5.4% |
| Immigrants | Hungary | 66.1 /100 | #155 | Good 5.4% |
| Czechoslovakians | 63.7 /100 | #156 | Good 5.4% |
| Albanians | 63.7 /100 | #157 | Good 5.4% |
| Immigrants | Belarus | 62.7 /100 | #158 | Good 5.4% |
| Immigrants | Croatia | 61.0 /100 | #159 | Good 5.4% |
| Immigrants | Scotland | 59.3 /100 | #160 | Average 5.4% |
| Austrians | 59.0 /100 | #161 | Average 5.4% |
| Brazilians | 58.2 /100 | #162 | Average 5.4% |
| Arabs | 57.7 /100 | #163 | Average 5.4% |
| Basques | 57.3 /100 | #164 | Average 5.4% |
| Welsh | 56.3 /100 | #165 | Average 5.4% |
| Immigrants | Thailand | 55.6 /100 | #166 | Average 5.4% |
| English | 54.8 /100 | #167 | Average 5.4% |
| South Americans | 52.9 /100 | #168 | Average 5.4% |
Demographics Similar to Vietnamese by Unemployment Among Ages 30 to 34 years
In terms of unemployment among ages 30 to 34 years, the demographic groups most similar to Vietnamese are West Indian (6.5%, a difference of 0.070%), Jamaican (6.5%, a difference of 0.27%), Barbadian (6.5%, a difference of 0.50%), Immigrants from Trinidad and Tobago (6.5%, a difference of 0.56%), and Trinidadian and Tobagonian (6.5%, a difference of 0.74%).
| Demographics | Rating | Rank | Unemployment Among Ages 30 to 34 years |
| Choctaw | 0.0 /100 | #285 | Tragic 6.4% |
| Central American Indians | 0.0 /100 | #286 | Tragic 6.4% |
| Immigrants | West Indies | 0.0 /100 | #287 | Tragic 6.4% |
| Senegalese | 0.0 /100 | #288 | Tragic 6.4% |
| Menominee | 0.0 /100 | #289 | Tragic 6.4% |
| Immigrants | Trinidad and Tobago | 0.0 /100 | #290 | Tragic 6.5% |
| Jamaicans | 0.0 /100 | #291 | Tragic 6.5% |
| Vietnamese | 0.0 /100 | #292 | Tragic 6.5% |
| West Indians | 0.0 /100 | #293 | Tragic 6.5% |
| Barbadians | 0.0 /100 | #294 | Tragic 6.5% |
| Trinidadians and Tobagonians | 0.0 /100 | #295 | Tragic 6.5% |
| Immigrants | Jamaica | 0.0 /100 | #296 | Tragic 6.5% |
| Creek | 0.0 /100 | #297 | Tragic 6.6% |
| Immigrants | Barbados | 0.0 /100 | #298 | Tragic 6.6% |
| Dutch West Indians | 0.0 /100 | #299 | Tragic 6.6% |