Austrian vs Yuman Unemployment Among Ages 30 to 34 years
COMPARE
Austrian
Yuman
Unemployment Among Ages 30 to 34 years
Unemployment Among Ages 30 to 34 years Comparison
Austrians
Yuman
5.4%
UNEMPLOYMENT AMONG AGES 30 TO 34 YEARS
59.0/ 100
METRIC RATING
161st/ 347
METRIC RANK
10.6%
UNEMPLOYMENT AMONG AGES 30 TO 34 YEARS
0.0/ 100
METRIC RATING
342nd/ 347
METRIC RANK
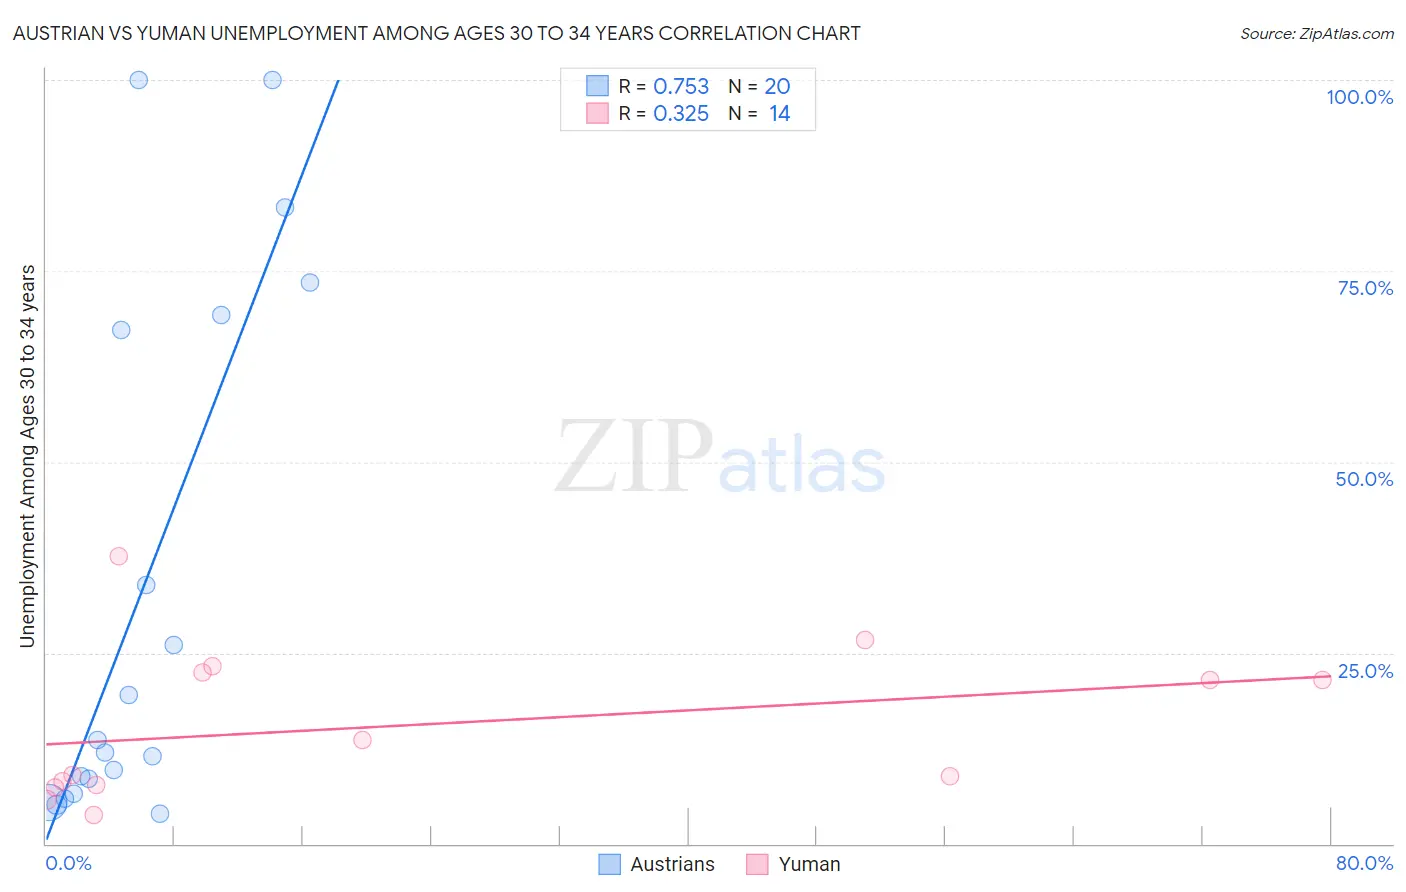
Austrian vs Yuman Unemployment Among Ages 30 to 34 years Correlation Chart
The statistical analysis conducted on geographies consisting of 414,053,097 people shows a strong positive correlation between the proportion of Austrians and unemployment rate among population between the ages 30 and 34 in the United States with a correlation coefficient (R) of 0.753 and weighted average of 5.4%. Similarly, the statistical analysis conducted on geographies consisting of 40,335,180 people shows a mild positive correlation between the proportion of Yuman and unemployment rate among population between the ages 30 and 34 in the United States with a correlation coefficient (R) of 0.325 and weighted average of 10.6%, a difference of 95.3%.
Unemployment Among Ages 30 to 34 years Correlation Summary
| Measurement | Austrian | Yuman |
| Minimum | 3.9% | 3.8% |
| Maximum | 100.0% | 37.6% |
| Range | 96.1% | 33.8% |
| Mean | 33.2% | 15.5% |
| Median | 12.8% | 11.3% |
| Interquartile 25% (IQ1) | 7.5% | 7.7% |
| Interquartile 75% (IQ3) | 68.2% | 22.4% |
| Interquartile Range (IQR) | 60.7% | 14.7% |
| Standard Deviation (Sample) | 34.6% | 10.0% |
| Standard Deviation (Population) | 33.7% | 9.6% |
Similar Demographics by Unemployment Among Ages 30 to 34 years
Demographics Similar to Austrians by Unemployment Among Ages 30 to 34 years
In terms of unemployment among ages 30 to 34 years, the demographic groups most similar to Austrians are Immigrants from Scotland (5.4%, a difference of 0.020%), Brazilian (5.4%, a difference of 0.050%), Arab (5.4%, a difference of 0.090%), Basque (5.4%, a difference of 0.12%), and Immigrants from Croatia (5.4%, a difference of 0.15%).
| Demographics | Rating | Rank | Unemployment Among Ages 30 to 34 years |
| South Africans | 66.5 /100 | #154 | Good 5.4% |
| Immigrants | Hungary | 66.1 /100 | #155 | Good 5.4% |
| Czechoslovakians | 63.7 /100 | #156 | Good 5.4% |
| Albanians | 63.7 /100 | #157 | Good 5.4% |
| Immigrants | Belarus | 62.7 /100 | #158 | Good 5.4% |
| Immigrants | Croatia | 61.0 /100 | #159 | Good 5.4% |
| Immigrants | Scotland | 59.3 /100 | #160 | Average 5.4% |
| Austrians | 59.0 /100 | #161 | Average 5.4% |
| Brazilians | 58.2 /100 | #162 | Average 5.4% |
| Arabs | 57.7 /100 | #163 | Average 5.4% |
| Basques | 57.3 /100 | #164 | Average 5.4% |
| Welsh | 56.3 /100 | #165 | Average 5.4% |
| Immigrants | Thailand | 55.6 /100 | #166 | Average 5.4% |
| English | 54.8 /100 | #167 | Average 5.4% |
| South Americans | 52.9 /100 | #168 | Average 5.4% |
Demographics Similar to Yuman by Unemployment Among Ages 30 to 34 years
In terms of unemployment among ages 30 to 34 years, the demographic groups most similar to Yuman are Navajo (10.6%, a difference of 0.40%), Inupiat (10.8%, a difference of 2.1%), Crow (10.3%, a difference of 2.4%), Tohono O'odham (9.8%, a difference of 7.8%), and Yakama (9.8%, a difference of 8.6%).
| Demographics | Rating | Rank | Unemployment Among Ages 30 to 34 years |
| Pueblo | 0.0 /100 | #333 | Tragic 8.3% |
| Alaska Natives | 0.0 /100 | #334 | Tragic 8.5% |
| Puerto Ricans | 0.0 /100 | #335 | Tragic 8.9% |
| Colville | 0.0 /100 | #336 | Tragic 9.0% |
| Pima | 0.0 /100 | #337 | Tragic 9.6% |
| Yakama | 0.0 /100 | #338 | Tragic 9.8% |
| Tohono O'odham | 0.0 /100 | #339 | Tragic 9.8% |
| Crow | 0.0 /100 | #340 | Tragic 10.3% |
| Navajo | 0.0 /100 | #341 | Tragic 10.6% |
| Yuman | 0.0 /100 | #342 | Tragic 10.6% |
| Inupiat | 0.0 /100 | #343 | Tragic 10.8% |
| Hopi | 0.0 /100 | #344 | Tragic 11.9% |
| Arapaho | 0.0 /100 | #345 | Tragic 12.8% |
| Tsimshian | 0.0 /100 | #346 | Tragic 13.8% |
| Yup'ik | 0.0 /100 | #347 | Tragic 18.5% |