West Indian vs Immigrants from Burma/Myanmar Unemployment Among Ages 30 to 34 years

COMPARE

West Indian
Race
Ancestry
AfghanAfricanAlaska NativeAlaskan AthabascanAlbanianAleutAlsatianAmericanApacheArabArapahoArgentineanArmenianAssyrian/Chaldean/SyriacAustralianAustrianBahamianBangladeshiBarbadianBasqueBelgianBelizeanBermudanBhutaneseBlackfeetBolivianBrazilianBritishBritish West IndianBulgarianBurmeseCajunCambodianCanadianCape VerdeanCarpatho RusynCelticCentral AmericanCentral American IndianCherokeeCheyenneChickasawChileanChineseChippewaChoctawColombianColvilleComancheCosta RicanCreeCreekCroatianCrowCubanCypriotCzechCzechoslovakianDanishDelawareDominicanDutchDutch West IndianEastern EuropeanEcuadorianEgyptianEnglishEstonianEthiopianEuropeanFijianFilipinoFinnishFrenchFrench American IndianFrench CanadianGermanGerman RussianGhanaianGreekGuamanian/ChamorroGuatemalanGuyaneseHaitianHmongHonduranHopiHoumaHungarianIcelanderIndian (Asian)IndonesianInupiatIranianIraqiIrishIroquoisIsraeliItalianJamaicanJapaneseJordanianKenyanKiowaKoreanLaotianLatvianLebaneseLiberianLithuanianLumbeeLuxembourgerMacedonianMalaysianMalteseMarshalleseMenomineeMexicanMexican American IndianMongolianMoroccanNative HawaiianNavajoNepaleseNew ZealanderNicaraguanNigerianNorthern EuropeanNorwegianOkinawanOsageOttawaPaiutePakistaniPalestinianPanamanianParaguayanPennsylvania GermanPeruvianPimaPolishPortuguesePotawatomiPuebloPuerto RicanPuget Sound SalishRomanianRussianSalvadoranSamoanScandinavianScotch-IrishScottishSeminoleSenegaleseSerbianShoshoneSierra LeoneanSiouxSlavicSlovakSloveneSomaliSouth AfricanSouth AmericanSouth American IndianSoviet UnionSpaniardSpanishSpanish AmericanSpanish American IndianSri LankanSubsaharan AfricanSudaneseSwedishSwissSyrianTaiwaneseThaiTlingit-HaidaTohono O'OdhamTonganTrinidadian and TobagonianTsimshianTurkishU.S. Virgin IslanderUgandanUkrainianUruguayanUteVenezuelanVietnameseWelshWest IndianYakamaYaquiYugoslavianYumanYup'ikZimbabwean
Immigration
NonimmigrantsImmigrantsAfghanistanAfricaAlbaniaArgentinaArmeniaAsiaAustraliaAustriaBahamasBangladeshBarbadosBelarusBelgiumBelizeBoliviaBosnia and HerzegovinaBrazilBulgariaCabo VerdeCambodiaCameroonCanadaCaribbeanCentral AmericaChileChinaColombiaCongoCosta RicaCroatiaCubaCzechoslovakiaDenmarkDominicaDominican RepublicEastern AfricaEastern AsiaEastern EuropeEcuadorEgyptEl SalvadorEnglandEritreaEthiopiaEuropeFijiFranceGermanyGhanaGreeceGrenadaGuatemalaGuyanaHaitiHondurasHong KongHungaryIndiaIndonesiaIranIraqIrelandIsraelItalyJamaicaJapanJordanKazakhstanKenyaKoreaKuwaitLaosLatin AmericaLatviaLebanonLiberiaLithuaniaMalaysiaMexicoMicronesiaMiddle AfricaMoldovaMoroccoNepalNetherlandsNicaraguaNigeriaNorth AmericaNorth MacedoniaNorthern AfricaNorthern EuropeNorwayOceaniaPakistanPanamaPeruPhilippinesPolandPortugalRomaniaRussiaSaudi ArabiaScotlandSenegalSerbiaSierra LeoneSingaporeSomaliaSouth AfricaSouth AmericaSouth Central AsiaSouth Eastern AsiaSouthern EuropeSpainSri LankaSt. Vincent and the GrenadinesSudanSwedenSwitzerlandSyriaTaiwanThailandTrinidad and TobagoTurkeyUgandaUkraineUruguayUzbekistanVenezuelaVietnamWest IndiesWestern AfricaWestern AsiaWestern EuropeYemenZaireZimbabweAzores
Immigrants from Burma/Myanmar
Race
Ancestry
AfghanAfricanAlaska NativeAlaskan AthabascanAlbanianAleutAlsatianAmericanApacheArabArapahoArgentineanArmenianAssyrian/Chaldean/SyriacAustralianAustrianBahamianBangladeshiBarbadianBasqueBelgianBelizeanBermudanBhutaneseBlackfeetBolivianBrazilianBritishBritish West IndianBulgarianBurmeseCajunCambodianCanadianCape VerdeanCarpatho RusynCelticCentral AmericanCentral American IndianCherokeeCheyenneChickasawChileanChineseChippewaChoctawColombianColvilleComancheCosta RicanCreeCreekCroatianCrowCubanCypriotCzechCzechoslovakianDanishDelawareDominicanDutchDutch West IndianEastern EuropeanEcuadorianEgyptianEnglishEstonianEthiopianEuropeanFijianFilipinoFinnishFrenchFrench American IndianFrench CanadianGermanGerman RussianGhanaianGreekGuamanian/ChamorroGuatemalanGuyaneseHaitianHmongHonduranHopiHoumaHungarianIcelanderIndian (Asian)IndonesianInupiatIranianIraqiIrishIroquoisIsraeliItalianJamaicanJapaneseJordanianKenyanKiowaKoreanLaotianLatvianLebaneseLiberianLithuanianLumbeeLuxembourgerMacedonianMalaysianMalteseMarshalleseMenomineeMexicanMexican American IndianMongolianMoroccanNative HawaiianNavajoNepaleseNew ZealanderNicaraguanNigerianNorthern EuropeanNorwegianOkinawanOsageOttawaPaiutePakistaniPalestinianPanamanianParaguayanPennsylvania GermanPeruvianPimaPolishPortuguesePotawatomiPuebloPuerto RicanPuget Sound SalishRomanianRussianSalvadoranSamoanScandinavianScotch-IrishScottishSeminoleSenegaleseSerbianShoshoneSierra LeoneanSiouxSlavicSlovakSloveneSomaliSouth AfricanSouth AmericanSouth American IndianSoviet UnionSpaniardSpanishSpanish AmericanSpanish American IndianSri LankanSubsaharan AfricanSudaneseSwedishSwissSyrianTaiwaneseThaiTlingit-HaidaTohono O'OdhamTonganTrinidadian and TobagonianTsimshianTurkishU.S. Virgin IslanderUgandanUkrainianUruguayanUteVenezuelanVietnameseWelshYakamaYaquiYugoslavianYumanYup'ikZimbabwean
Immigration
NonimmigrantsImmigrantsAfghanistanAfricaAlbaniaArgentinaArmeniaAsiaAustraliaAustriaBahamasBangladeshBarbadosBelarusBelgiumBelizeBoliviaBosnia and HerzegovinaBrazilBulgariaBurma/MyanmarCabo VerdeCambodiaCameroonCanadaCaribbeanCentral AmericaChileChinaColombiaCongoCosta RicaCroatiaCubaCzechoslovakiaDenmarkDominicaDominican RepublicEastern AfricaEastern AsiaEastern EuropeEcuadorEgyptEl SalvadorEnglandEritreaEthiopiaEuropeFijiFranceGermanyGhanaGreeceGrenadaGuatemalaGuyanaHaitiHondurasHong KongHungaryIndiaIndonesiaIranIraqIrelandIsraelItalyJamaicaJapanJordanKazakhstanKenyaKoreaKuwaitLaosLatin AmericaLatviaLebanonLiberiaLithuaniaMalaysiaMexicoMicronesiaMiddle AfricaMoldovaMoroccoNepalNetherlandsNicaraguaNigeriaNorth AmericaNorth MacedoniaNorthern AfricaNorthern EuropeNorwayOceaniaPakistanPanamaPeruPhilippinesPolandPortugalRomaniaRussiaSaudi ArabiaScotlandSenegalSerbiaSierra LeoneSingaporeSomaliaSouth AfricaSouth AmericaSouth Central AsiaSouth Eastern AsiaSouthern EuropeSpainSri LankaSt. Vincent and the GrenadinesSudanSwedenSwitzerlandSyriaTaiwanThailandTrinidad and TobagoTurkeyUgandaUkraineUruguayUzbekistanVenezuelaVietnamWest IndiesWestern AfricaWestern AsiaWestern EuropeYemenZaireZimbabweAzores
Unemployment Among Ages 30 to 34 years
Income
Poverty
Unemployment
Labor Participation
Family Structure
Vehicle Availability
Education Level
Disability

Unemployment Among Ages 30 to 34 years Comparison

West Indians

Immigrants from Burma/Myanmar

Tragic
Exceptional
6.5%
UNEMPLOYMENT AMONG AGES 30 TO 34 YEARS
0.0/ 100
METRIC RATING
293rd/ 347
METRIC RANK
5.1%
UNEMPLOYMENT AMONG AGES 30 TO 34 YEARS
98.1/ 100
METRIC RATING
52nd/ 347
METRIC RANK

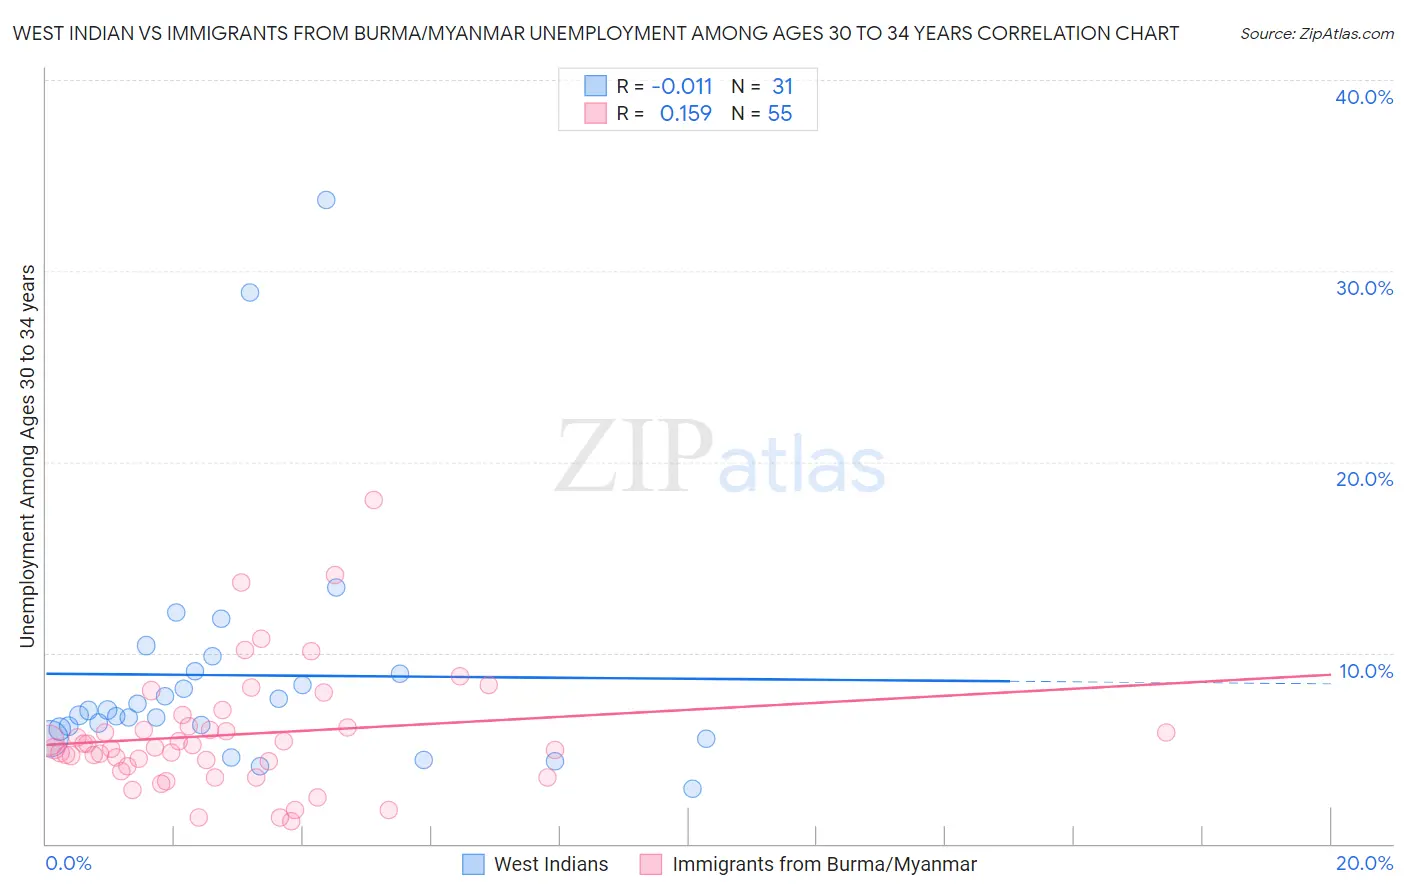
West Indian vs Immigrants from Burma/Myanmar Unemployment Among Ages 30 to 34 years Correlation Chart

The statistical analysis conducted on geographies consisting of 246,603,310 people shows no correlation between the proportion of West Indians and unemployment rate among population between the ages 30 and 34 in the United States with a correlation coefficient (R) of -0.011 and weighted average of 6.5%. Similarly, the statistical analysis conducted on geographies consisting of 168,858,886 people shows a poor positive correlation between the proportion of Immigrants from Burma/Myanmar and unemployment rate among population between the ages 30 and 34 in the United States with a correlation coefficient (R) of 0.159 and weighted average of 5.1%, a difference of 27.9%.
West Indian vs Immigrants from Burma/Myanmar Unemployment Among Ages 30 to 34 years

Unemployment Among Ages 30 to 34 years Correlation Summary

MeasurementWest IndianImmigrants from Burma/Myanmar
Minimum2.9%1.2%
Maximum33.7%18.0%
Range30.8%16.8%
Mean8.8%5.7%
Median7.0%5.0%
Interquartile 25% (IQ1)6.0%4.1%
Interquartile 75% (IQ3)9.0%6.2%
Interquartile Range (IQR)3.0%2.1%
Standard Deviation (Sample)6.5%3.2%
Standard Deviation (Population)6.4%3.1%

Similar Demographics by Unemployment Among Ages 30 to 34 years

Demographics Similar to West Indians by Unemployment Among Ages 30 to 34 years

In terms of unemployment among ages 30 to 34 years, the demographic groups most similar to West Indians are Vietnamese (6.5%, a difference of 0.070%), Jamaican (6.5%, a difference of 0.35%), Barbadian (6.5%, a difference of 0.43%), Immigrants from Trinidad and Tobago (6.5%, a difference of 0.64%), and Trinidadian and Tobagonian (6.5%, a difference of 0.66%).
DemographicsRating | RankUnemployment Among Ages 30 to 34 years
Central American Indians
0.0
/100
|
#286
Tragic
6.4%
Immigrants | West Indies
0.0
/100
|
#287
Tragic
6.4%
Senegalese
0.0
/100
|
#288
Tragic
6.4%
Menominee
0.0
/100
|
#289
Tragic
6.4%
Immigrants | Trinidad and Tobago
0.0
/100
|
#290
Tragic
6.5%
Jamaicans
0.0
/100
|
#291
Tragic
6.5%
Vietnamese
0.0
/100
|
#292
Tragic
6.5%
West Indians
0.0
/100
|
#293
Tragic
6.5%
Barbadians
0.0
/100
|
#294
Tragic
6.5%
Trinidadians and Tobagonians
0.0
/100
|
#295
Tragic
6.5%
Immigrants | Jamaica
0.0
/100
|
#296
Tragic
6.5%
Creek
0.0
/100
|
#297
Tragic
6.6%
Immigrants | Barbados
0.0
/100
|
#298
Tragic
6.6%
Dutch West Indians
0.0
/100
|
#299
Tragic
6.6%
Bahamians
0.0
/100
|
#300
Tragic
6.6%

Demographics Similar to Immigrants from Burma/Myanmar by Unemployment Among Ages 30 to 34 years

In terms of unemployment among ages 30 to 34 years, the demographic groups most similar to Immigrants from Burma/Myanmar are Turkish (5.1%, a difference of 0.040%), Cuban (5.1%, a difference of 0.050%), Puget Sound Salish (5.1%, a difference of 0.070%), Immigrants from Malaysia (5.1%, a difference of 0.14%), and Immigrants from Morocco (5.1%, a difference of 0.23%).
DemographicsRating | RankUnemployment Among Ages 30 to 34 years
Yugoslavians
98.6
/100
|
#45
Exceptional
5.1%
Immigrants | Congo
98.4
/100
|
#46
Exceptional
5.1%
Cypriots
98.4
/100
|
#47
Exceptional
5.1%
Assyrians/Chaldeans/Syriacs
98.4
/100
|
#48
Exceptional
5.1%
Immigrants | Malaysia
98.3
/100
|
#49
Exceptional
5.1%
Puget Sound Salish
98.2
/100
|
#50
Exceptional
5.1%
Turks
98.2
/100
|
#51
Exceptional
5.1%
Immigrants | Burma/Myanmar
98.1
/100
|
#52
Exceptional
5.1%
Cubans
98.1
/100
|
#53
Exceptional
5.1%
Immigrants | Morocco
97.9
/100
|
#54
Exceptional
5.1%
Chinese
97.7
/100
|
#55
Exceptional
5.1%
Immigrants | Serbia
97.4
/100
|
#56
Exceptional
5.1%
Immigrants | China
97.2
/100
|
#57
Exceptional
5.1%
Asians
97.2
/100
|
#58
Exceptional
5.1%
Swedes
97.1
/100
|
#59
Exceptional
5.1%