Slovak vs Pakistani Unemployment Among Ages 20 to 24 years
COMPARE
Slovak
Pakistani
Unemployment Among Ages 20 to 24 years
Unemployment Among Ages 20 to 24 years Comparison
Slovaks
Pakistanis
10.2%
UNEMPLOYMENT AMONG AGES 20 TO 24 YEARS
80.2/ 100
METRIC RATING
142nd/ 347
METRIC RANK
9.8%
UNEMPLOYMENT AMONG AGES 20 TO 24 YEARS
99.5/ 100
METRIC RATING
58th/ 347
METRIC RANK
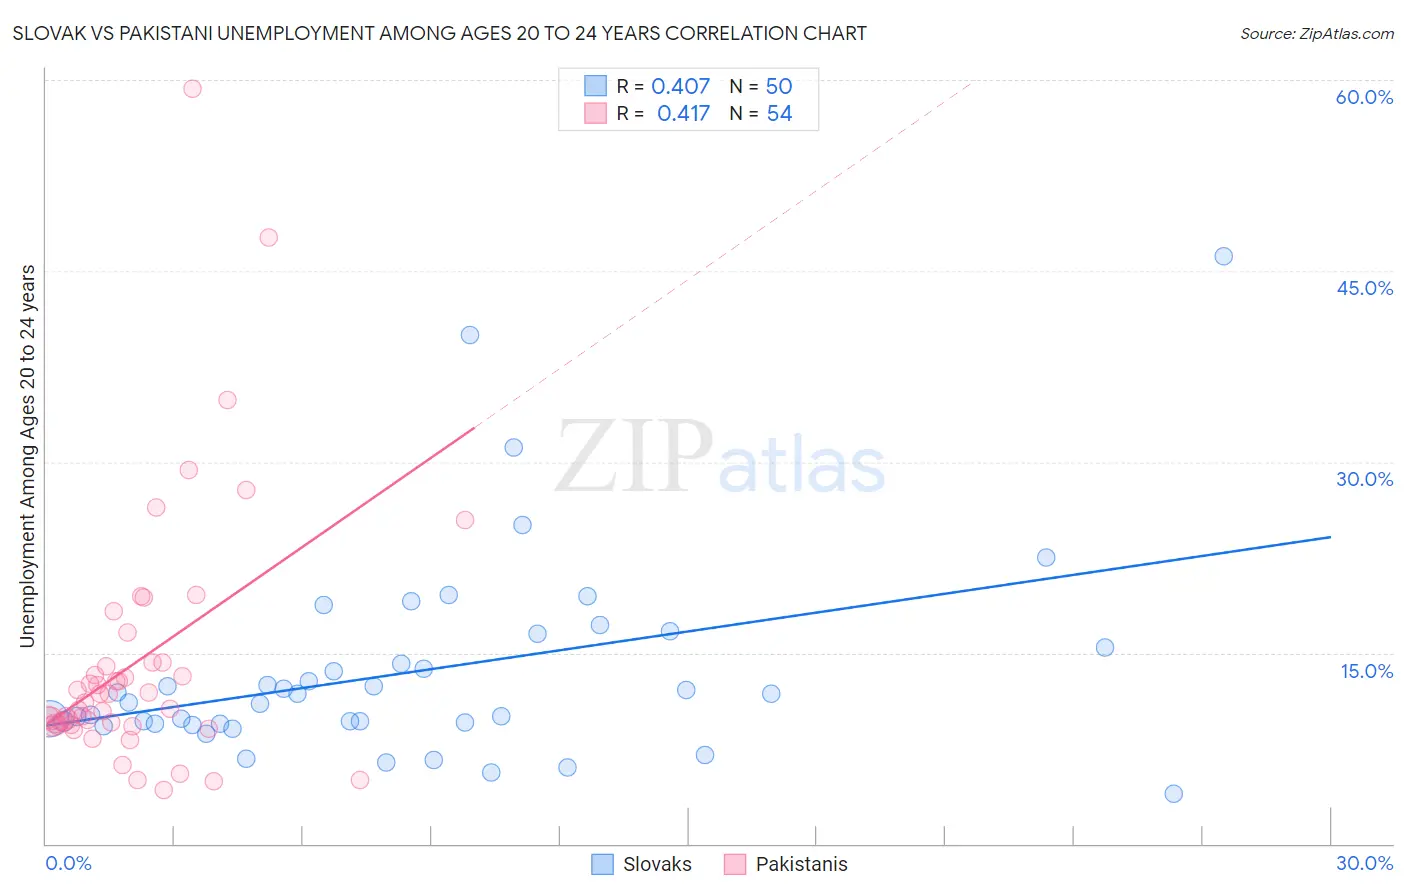
Slovak vs Pakistani Unemployment Among Ages 20 to 24 years Correlation Chart
The statistical analysis conducted on geographies consisting of 381,138,235 people shows a moderate positive correlation between the proportion of Slovaks and unemployment rate among population between the ages 20 and 24 in the United States with a correlation coefficient (R) of 0.407 and weighted average of 10.2%. Similarly, the statistical analysis conducted on geographies consisting of 328,618,877 people shows a moderate positive correlation between the proportion of Pakistanis and unemployment rate among population between the ages 20 and 24 in the United States with a correlation coefficient (R) of 0.417 and weighted average of 9.8%, a difference of 3.7%.
Unemployment Among Ages 20 to 24 years Correlation Summary
| Measurement | Slovak | Pakistani |
| Minimum | 3.9% | 4.2% |
| Maximum | 46.2% | 59.3% |
| Range | 42.3% | 55.1% |
| Mean | 13.5% | 14.2% |
| Median | 11.5% | 10.8% |
| Interquartile 25% (IQ1) | 9.5% | 9.3% |
| Interquartile 75% (IQ3) | 15.4% | 14.2% |
| Interquartile Range (IQR) | 5.9% | 4.9% |
| Standard Deviation (Sample) | 8.0% | 10.1% |
| Standard Deviation (Population) | 7.9% | 10.0% |
Similar Demographics by Unemployment Among Ages 20 to 24 years
Demographics Similar to Slovaks by Unemployment Among Ages 20 to 24 years
In terms of unemployment among ages 20 to 24 years, the demographic groups most similar to Slovaks are Immigrants from Austria (10.2%, a difference of 0.070%), Immigrants from the Azores (10.2%, a difference of 0.070%), Immigrants from Jordan (10.2%, a difference of 0.070%), Uruguayan (10.2%, a difference of 0.10%), and Brazilian (10.2%, a difference of 0.11%).
| Demographics | Rating | Rank | Unemployment Among Ages 20 to 24 years |
| Comanche | 83.4 /100 | #135 | Excellent 10.2% |
| Immigrants | Northern Africa | 82.5 /100 | #136 | Excellent 10.2% |
| Immigrants | North America | 82.5 /100 | #137 | Excellent 10.2% |
| Burmese | 82.3 /100 | #138 | Excellent 10.2% |
| Uruguayans | 81.9 /100 | #139 | Excellent 10.2% |
| Immigrants | Austria | 81.4 /100 | #140 | Excellent 10.2% |
| Immigrants | Azores | 81.4 /100 | #141 | Excellent 10.2% |
| Slovaks | 80.2 /100 | #142 | Excellent 10.2% |
| Immigrants | Jordan | 79.0 /100 | #143 | Good 10.2% |
| Brazilians | 78.4 /100 | #144 | Good 10.2% |
| Argentineans | 78.0 /100 | #145 | Good 10.2% |
| Asians | 77.7 /100 | #146 | Good 10.2% |
| French Canadians | 77.5 /100 | #147 | Good 10.2% |
| Immigrants | Romania | 75.7 /100 | #148 | Good 10.2% |
| Immigrants | Scotland | 74.6 /100 | #149 | Good 10.2% |
Demographics Similar to Pakistanis by Unemployment Among Ages 20 to 24 years
In terms of unemployment among ages 20 to 24 years, the demographic groups most similar to Pakistanis are English (9.8%, a difference of 0.0%), Immigrants from Kuwait (9.8%, a difference of 0.030%), Immigrants from Moldova (9.8%, a difference of 0.050%), Malaysian (9.8%, a difference of 0.050%), and Immigrants from Singapore (9.8%, a difference of 0.15%).
| Demographics | Rating | Rank | Unemployment Among Ages 20 to 24 years |
| Ethiopians | 99.7 /100 | #51 | Exceptional 9.8% |
| Immigrants | Thailand | 99.7 /100 | #52 | Exceptional 9.8% |
| Immigrants | Serbia | 99.6 /100 | #53 | Exceptional 9.8% |
| Immigrants | Cambodia | 99.6 /100 | #54 | Exceptional 9.8% |
| Carpatho Rusyns | 99.6 /100 | #55 | Exceptional 9.8% |
| Nicaraguans | 99.6 /100 | #56 | Exceptional 9.8% |
| Immigrants | Moldova | 99.5 /100 | #57 | Exceptional 9.8% |
| Pakistanis | 99.5 /100 | #58 | Exceptional 9.8% |
| English | 99.5 /100 | #59 | Exceptional 9.8% |
| Immigrants | Kuwait | 99.5 /100 | #60 | Exceptional 9.8% |
| Malaysians | 99.5 /100 | #61 | Exceptional 9.8% |
| Immigrants | Singapore | 99.4 /100 | #62 | Exceptional 9.8% |
| British | 99.4 /100 | #63 | Exceptional 9.8% |
| Serbians | 99.4 /100 | #64 | Exceptional 9.8% |
| Welsh | 99.3 /100 | #65 | Exceptional 9.8% |