Italian vs Indonesian Unemployment Among Youth under 25 years
COMPARE
Italian
Indonesian
Unemployment Among Youth under 25 years
Unemployment Among Youth under 25 years Comparison
Italians
Indonesians
11.4%
UNEMPLOYMENT AMONG YOUTH UNDER 25 YEARS
87.2/ 100
METRIC RATING
124th/ 347
METRIC RANK
10.6%
UNEMPLOYMENT AMONG YOUTH UNDER 25 YEARS
100.0/ 100
METRIC RATING
13th/ 347
METRIC RANK
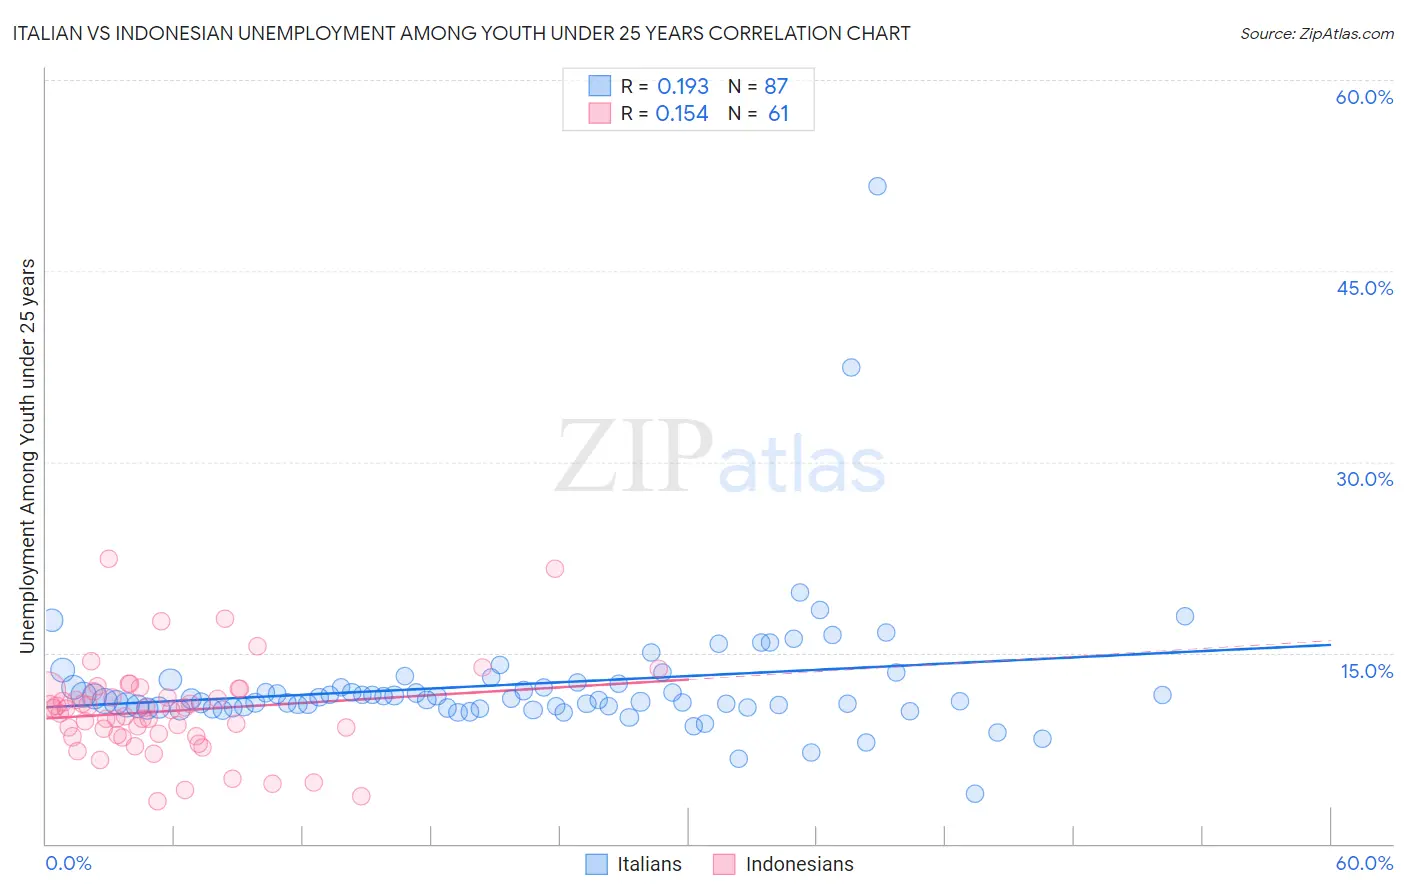
Italian vs Indonesian Unemployment Among Youth under 25 years Correlation Chart
The statistical analysis conducted on geographies consisting of 549,839,385 people shows a poor positive correlation between the proportion of Italians and unemployment rate among youth under the age of 25 in the United States with a correlation coefficient (R) of 0.193 and weighted average of 11.4%. Similarly, the statistical analysis conducted on geographies consisting of 162,194,941 people shows a poor positive correlation between the proportion of Indonesians and unemployment rate among youth under the age of 25 in the United States with a correlation coefficient (R) of 0.154 and weighted average of 10.6%, a difference of 7.7%.
Unemployment Among Youth under 25 years Correlation Summary
| Measurement | Italian | Indonesian |
| Minimum | 3.9% | 3.3% |
| Maximum | 51.7% | 22.4% |
| Range | 47.8% | 19.1% |
| Mean | 12.5% | 10.4% |
| Median | 11.3% | 10.5% |
| Interquartile 25% (IQ1) | 10.7% | 8.5% |
| Interquartile 75% (IQ3) | 12.6% | 12.0% |
| Interquartile Range (IQR) | 1.8% | 3.5% |
| Standard Deviation (Sample) | 5.6% | 3.6% |
| Standard Deviation (Population) | 5.6% | 3.6% |
Similar Demographics by Unemployment Among Youth under 25 years
Demographics Similar to Italians by Unemployment Among Youth under 25 years
In terms of unemployment among youth under 25 years, the demographic groups most similar to Italians are Immigrants from Argentina (11.4%, a difference of 0.0%), Canadian (11.4%, a difference of 0.050%), Basque (11.4%, a difference of 0.060%), Immigrants from Micronesia (11.4%, a difference of 0.090%), and Greek (11.4%, a difference of 0.090%).
| Demographics | Rating | Rank | Unemployment Among Youth under 25 years |
| Sri Lankans | 89.8 /100 | #117 | Excellent 11.3% |
| Afghans | 89.7 /100 | #118 | Excellent 11.3% |
| Immigrants | Scotland | 89.2 /100 | #119 | Excellent 11.4% |
| Malaysians | 89.0 /100 | #120 | Excellent 11.4% |
| Slovaks | 88.9 /100 | #121 | Excellent 11.4% |
| Immigrants | Micronesia | 88.1 /100 | #122 | Excellent 11.4% |
| Basques | 87.8 /100 | #123 | Excellent 11.4% |
| Italians | 87.2 /100 | #124 | Excellent 11.4% |
| Immigrants | Argentina | 87.2 /100 | #125 | Excellent 11.4% |
| Canadians | 86.6 /100 | #126 | Excellent 11.4% |
| Greeks | 86.2 /100 | #127 | Excellent 11.4% |
| Immigrants | Hungary | 86.0 /100 | #128 | Excellent 11.4% |
| Turks | 85.8 /100 | #129 | Excellent 11.4% |
| Hungarians | 85.7 /100 | #130 | Excellent 11.4% |
| Immigrants | Spain | 84.6 /100 | #131 | Excellent 11.4% |
Demographics Similar to Indonesians by Unemployment Among Youth under 25 years
In terms of unemployment among youth under 25 years, the demographic groups most similar to Indonesians are Cuban (10.6%, a difference of 0.020%), Immigrants from Sudan (10.5%, a difference of 0.12%), Sudanese (10.6%, a difference of 0.13%), Venezuelan (10.6%, a difference of 0.14%), and Menominee (10.6%, a difference of 0.19%).
| Demographics | Rating | Rank | Unemployment Among Youth under 25 years |
| Danes | 100.0 /100 | #6 | Exceptional 10.3% |
| Swedes | 100.0 /100 | #7 | Exceptional 10.4% |
| Immigrants | Venezuela | 100.0 /100 | #8 | Exceptional 10.5% |
| Germans | 100.0 /100 | #9 | Exceptional 10.5% |
| Immigrants | Somalia | 100.0 /100 | #10 | Exceptional 10.5% |
| Scandinavians | 100.0 /100 | #11 | Exceptional 10.5% |
| Immigrants | Sudan | 100.0 /100 | #12 | Exceptional 10.5% |
| Indonesians | 100.0 /100 | #13 | Exceptional 10.6% |
| Cubans | 100.0 /100 | #14 | Exceptional 10.6% |
| Sudanese | 100.0 /100 | #15 | Exceptional 10.6% |
| Venezuelans | 100.0 /100 | #16 | Exceptional 10.6% |
| Menominee | 100.0 /100 | #17 | Exceptional 10.6% |
| Swiss | 100.0 /100 | #18 | Exceptional 10.6% |
| Immigrants | Burma/Myanmar | 100.0 /100 | #19 | Exceptional 10.6% |
| Dutch | 100.0 /100 | #20 | Exceptional 10.6% |