Assyrian/Chaldean/Syriac vs Spaniard Unemployment Among Youth under 25 years
COMPARE
Assyrian/Chaldean/Syriac
Spaniard
Unemployment Among Youth under 25 years
Unemployment Among Youth under 25 years Comparison
Assyrians/Chaldeans/Syriacs
Spaniards
11.9%
UNEMPLOYMENT AMONG YOUTH UNDER 25 YEARS
9.8/ 100
METRIC RATING
210th/ 347
METRIC RANK
11.7%
UNEMPLOYMENT AMONG YOUTH UNDER 25 YEARS
39.8/ 100
METRIC RATING
180th/ 347
METRIC RANK
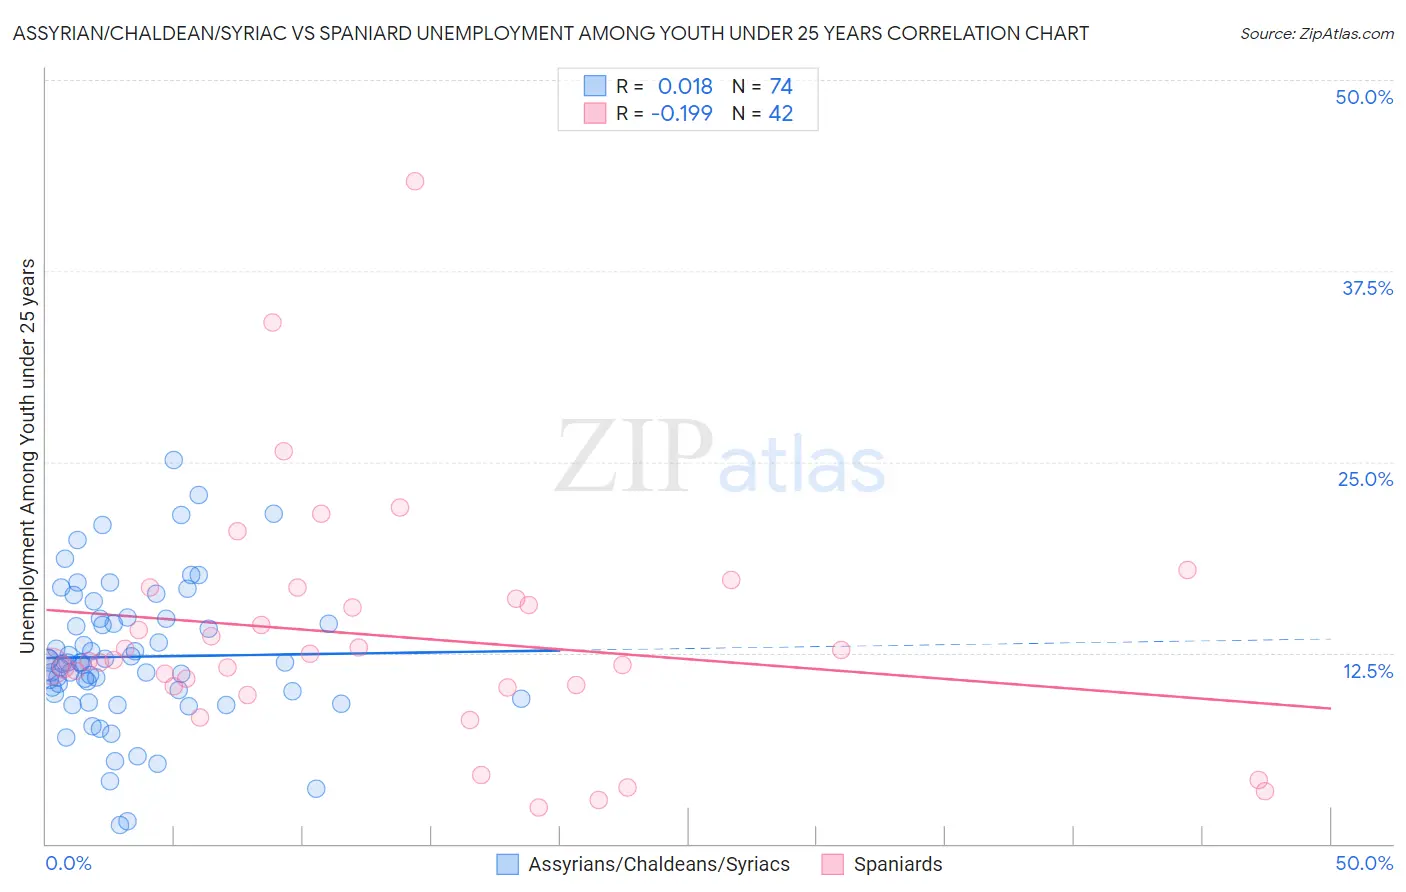
Assyrian/Chaldean/Syriac vs Spaniard Unemployment Among Youth under 25 years Correlation Chart
The statistical analysis conducted on geographies consisting of 109,923,358 people shows no correlation between the proportion of Assyrians/Chaldeans/Syriacs and unemployment rate among youth under the age of 25 in the United States with a correlation coefficient (R) of 0.018 and weighted average of 11.9%. Similarly, the statistical analysis conducted on geographies consisting of 436,438,930 people shows a poor negative correlation between the proportion of Spaniards and unemployment rate among youth under the age of 25 in the United States with a correlation coefficient (R) of -0.199 and weighted average of 11.7%, a difference of 1.8%.
Unemployment Among Youth under 25 years Correlation Summary
| Measurement | Assyrian/Chaldean/Syriac | Spaniard |
| Minimum | 1.2% | 2.4% |
| Maximum | 25.1% | 43.4% |
| Range | 23.9% | 41.0% |
| Mean | 12.2% | 13.6% |
| Median | 11.9% | 12.0% |
| Interquartile 25% (IQ1) | 9.8% | 10.3% |
| Interquartile 75% (IQ3) | 14.7% | 16.1% |
| Interquartile Range (IQR) | 4.9% | 5.8% |
| Standard Deviation (Sample) | 4.6% | 7.8% |
| Standard Deviation (Population) | 4.6% | 7.7% |
Similar Demographics by Unemployment Among Youth under 25 years
Demographics Similar to Assyrians/Chaldeans/Syriacs by Unemployment Among Youth under 25 years
In terms of unemployment among youth under 25 years, the demographic groups most similar to Assyrians/Chaldeans/Syriacs are Immigrants from Philippines (11.9%, a difference of 0.070%), Colombian (11.9%, a difference of 0.090%), Immigrants from Lebanon (11.8%, a difference of 0.15%), South American (11.9%, a difference of 0.16%), and Costa Rican (11.9%, a difference of 0.21%).
| Demographics | Rating | Rank | Unemployment Among Youth under 25 years |
| Immigrants | Peru | 15.3 /100 | #203 | Poor 11.8% |
| Immigrants | Costa Rica | 15.2 /100 | #204 | Poor 11.8% |
| Peruvians | 14.0 /100 | #205 | Poor 11.8% |
| Immigrants | Pakistan | 12.6 /100 | #206 | Poor 11.8% |
| Immigrants | Southern Europe | 12.3 /100 | #207 | Poor 11.8% |
| Comanche | 12.1 /100 | #208 | Poor 11.8% |
| Immigrants | Lebanon | 11.3 /100 | #209 | Poor 11.8% |
| Assyrians/Chaldeans/Syriacs | 9.8 /100 | #210 | Tragic 11.9% |
| Immigrants | Philippines | 9.2 /100 | #211 | Tragic 11.9% |
| Colombians | 9.1 /100 | #212 | Tragic 11.9% |
| South Americans | 8.5 /100 | #213 | Tragic 11.9% |
| Costa Ricans | 8.2 /100 | #214 | Tragic 11.9% |
| Samoans | 7.4 /100 | #215 | Tragic 11.9% |
| Guamanians/Chamorros | 7.0 /100 | #216 | Tragic 11.9% |
| Yaqui | 6.9 /100 | #217 | Tragic 11.9% |
Demographics Similar to Spaniards by Unemployment Among Youth under 25 years
In terms of unemployment among youth under 25 years, the demographic groups most similar to Spaniards are Syrian (11.7%, a difference of 0.060%), Immigrants from Europe (11.6%, a difference of 0.11%), Immigrants from Hong Kong (11.6%, a difference of 0.11%), Immigrants from Italy (11.7%, a difference of 0.16%), and Immigrants from Denmark (11.6%, a difference of 0.22%).
| Demographics | Rating | Rank | Unemployment Among Youth under 25 years |
| Immigrants | South Eastern Asia | 51.7 /100 | #173 | Average 11.6% |
| Immigrants | China | 50.0 /100 | #174 | Average 11.6% |
| Immigrants | Iraq | 47.0 /100 | #175 | Average 11.6% |
| Ugandans | 45.6 /100 | #176 | Average 11.6% |
| Immigrants | Denmark | 45.0 /100 | #177 | Average 11.6% |
| Immigrants | Europe | 42.4 /100 | #178 | Average 11.6% |
| Immigrants | Hong Kong | 42.4 /100 | #179 | Average 11.6% |
| Spaniards | 39.8 /100 | #180 | Fair 11.7% |
| Syrians | 38.4 /100 | #181 | Fair 11.7% |
| Immigrants | Italy | 36.2 /100 | #182 | Fair 11.7% |
| Americans | 34.5 /100 | #183 | Fair 11.7% |
| Immigrants | Eastern Europe | 34.1 /100 | #184 | Fair 11.7% |
| French American Indians | 34.0 /100 | #185 | Fair 11.7% |
| Maltese | 33.9 /100 | #186 | Fair 11.7% |
| Immigrants | Egypt | 31.9 /100 | #187 | Fair 11.7% |