Assyrian/Chaldean/Syriac vs Immigrants from Jordan Female Unemployment
COMPARE
Assyrian/Chaldean/Syriac
Immigrants from Jordan
Female Unemployment
Female Unemployment Comparison
Assyrians/Chaldeans/Syriacs
Immigrants from Jordan
5.6%
FEMALE UNEMPLOYMENT
0.8/ 100
METRIC RATING
251st/ 347
METRIC RANK
5.1%
FEMALE UNEMPLOYMENT
80.4/ 100
METRIC RATING
144th/ 347
METRIC RANK
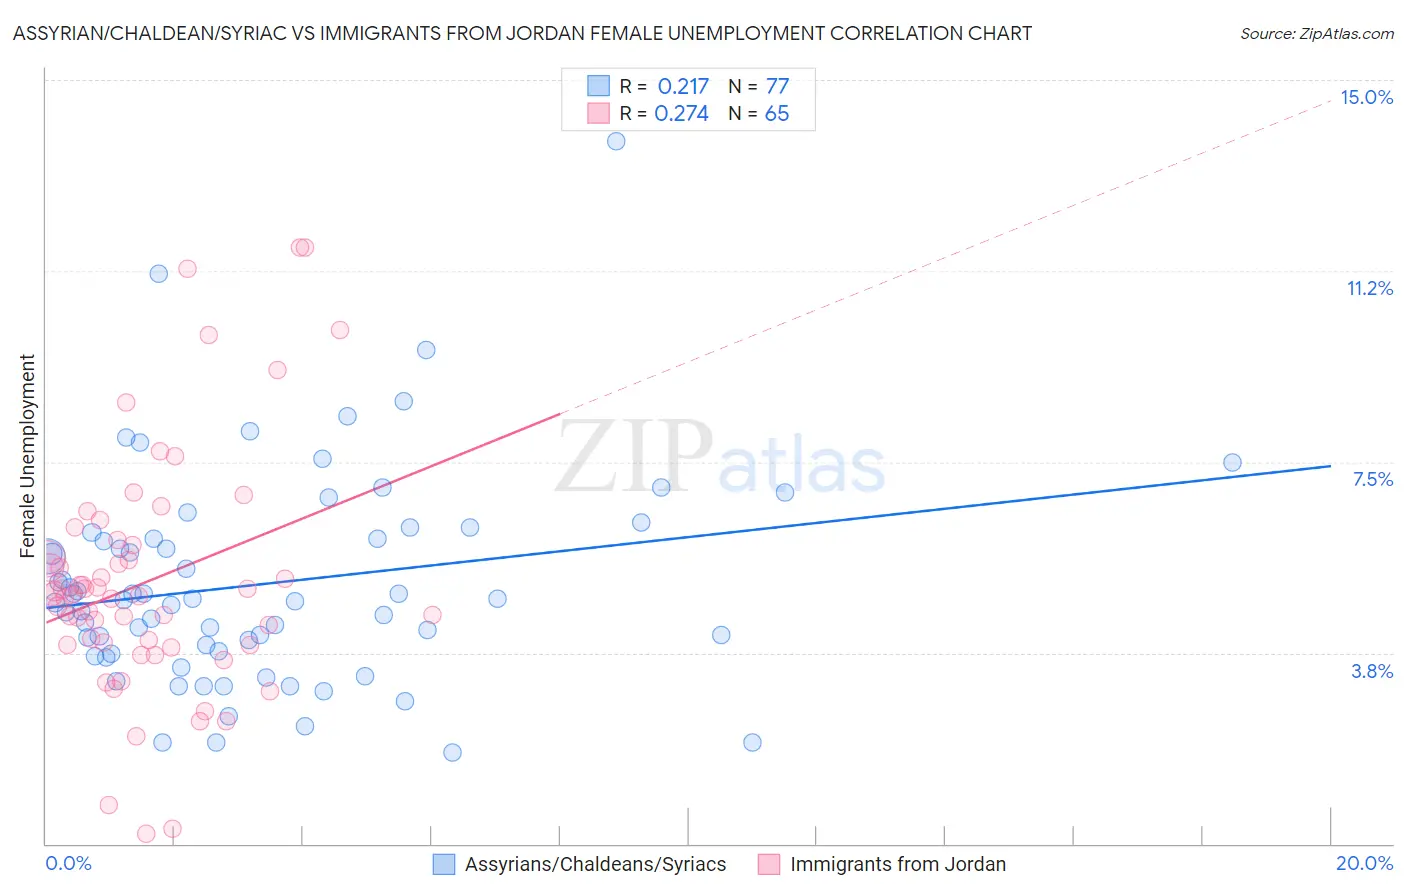
Assyrian/Chaldean/Syriac vs Immigrants from Jordan Female Unemployment Correlation Chart
The statistical analysis conducted on geographies consisting of 110,254,844 people shows a weak positive correlation between the proportion of Assyrians/Chaldeans/Syriacs and unemploymnet rate among females in the United States with a correlation coefficient (R) of 0.217 and weighted average of 5.6%. Similarly, the statistical analysis conducted on geographies consisting of 181,116,498 people shows a weak positive correlation between the proportion of Immigrants from Jordan and unemploymnet rate among females in the United States with a correlation coefficient (R) of 0.274 and weighted average of 5.1%, a difference of 9.7%.
Female Unemployment Correlation Summary
| Measurement | Assyrian/Chaldean/Syriac | Immigrants from Jordan |
| Minimum | 1.8% | 0.20% |
| Maximum | 13.8% | 11.7% |
| Range | 12.0% | 11.5% |
| Mean | 5.1% | 5.2% |
| Median | 4.8% | 4.9% |
| Interquartile 25% (IQ1) | 3.8% | 3.9% |
| Interquartile 75% (IQ3) | 6.1% | 5.9% |
| Interquartile Range (IQR) | 2.3% | 2.0% |
| Standard Deviation (Sample) | 2.1% | 2.4% |
| Standard Deviation (Population) | 2.1% | 2.4% |
Similar Demographics by Female Unemployment
Demographics Similar to Assyrians/Chaldeans/Syriacs by Female Unemployment
In terms of female unemployment, the demographic groups most similar to Assyrians/Chaldeans/Syriacs are Immigrants from Syria (5.6%, a difference of 0.060%), Cajun (5.7%, a difference of 0.20%), Immigrants from Sierra Leone (5.7%, a difference of 0.34%), Immigrants (5.7%, a difference of 0.34%), and Immigrants from Uzbekistan (5.6%, a difference of 0.35%).
| Demographics | Rating | Rank | Female Unemployment |
| Immigrants | Liberia | 1.5 /100 | #244 | Tragic 5.6% |
| Guamanians/Chamorros | 1.4 /100 | #245 | Tragic 5.6% |
| Japanese | 1.2 /100 | #246 | Tragic 5.6% |
| Immigrants | Western Asia | 1.1 /100 | #247 | Tragic 5.6% |
| Cree | 1.0 /100 | #248 | Tragic 5.6% |
| Immigrants | Uzbekistan | 1.0 /100 | #249 | Tragic 5.6% |
| Immigrants | Syria | 0.8 /100 | #250 | Tragic 5.6% |
| Assyrians/Chaldeans/Syriacs | 0.8 /100 | #251 | Tragic 5.6% |
| Cajuns | 0.7 /100 | #252 | Tragic 5.7% |
| Immigrants | Sierra Leone | 0.6 /100 | #253 | Tragic 5.7% |
| Immigrants | Immigrants | 0.6 /100 | #254 | Tragic 5.7% |
| Immigrants | Cameroon | 0.6 /100 | #255 | Tragic 5.7% |
| Sub-Saharan Africans | 0.4 /100 | #256 | Tragic 5.7% |
| Dutch West Indians | 0.3 /100 | #257 | Tragic 5.7% |
| Immigrants | Portugal | 0.2 /100 | #258 | Tragic 5.8% |
Demographics Similar to Immigrants from Jordan by Female Unemployment
In terms of female unemployment, the demographic groups most similar to Immigrants from Jordan are Immigrants from Kazakhstan (5.1%, a difference of 0.030%), Palestinian (5.1%, a difference of 0.040%), Immigrants from Oceania (5.2%, a difference of 0.090%), Immigrants from Norway (5.2%, a difference of 0.10%), and Immigrants from Eastern Europe (5.1%, a difference of 0.11%).
| Demographics | Rating | Rank | Female Unemployment |
| Pakistanis | 83.8 /100 | #137 | Excellent 5.1% |
| Chickasaw | 83.2 /100 | #138 | Excellent 5.1% |
| Immigrants | Eastern Asia | 83.0 /100 | #139 | Excellent 5.1% |
| Immigrants | France | 82.7 /100 | #140 | Excellent 5.1% |
| Immigrants | Eastern Europe | 81.5 /100 | #141 | Excellent 5.1% |
| Palestinians | 80.8 /100 | #142 | Excellent 5.1% |
| Immigrants | Kazakhstan | 80.7 /100 | #143 | Excellent 5.1% |
| Immigrants | Jordan | 80.4 /100 | #144 | Excellent 5.1% |
| Immigrants | Oceania | 79.5 /100 | #145 | Good 5.2% |
| Immigrants | Norway | 79.4 /100 | #146 | Good 5.2% |
| Argentineans | 79.2 /100 | #147 | Good 5.2% |
| Immigrants | Argentina | 78.7 /100 | #148 | Good 5.2% |
| Asians | 78.3 /100 | #149 | Good 5.2% |
| Egyptians | 78.3 /100 | #150 | Good 5.2% |
| Immigrants | China | 75.9 /100 | #151 | Good 5.2% |