Asian vs Puerto Rican Female Unemployment
COMPARE
Asian
Puerto Rican
Female Unemployment
Female Unemployment Comparison
Asians
Puerto Ricans
5.2%
FEMALE UNEMPLOYMENT
78.3/ 100
METRIC RATING
149th/ 347
METRIC RANK
8.3%
FEMALE UNEMPLOYMENT
0.0/ 100
METRIC RATING
342nd/ 347
METRIC RANK
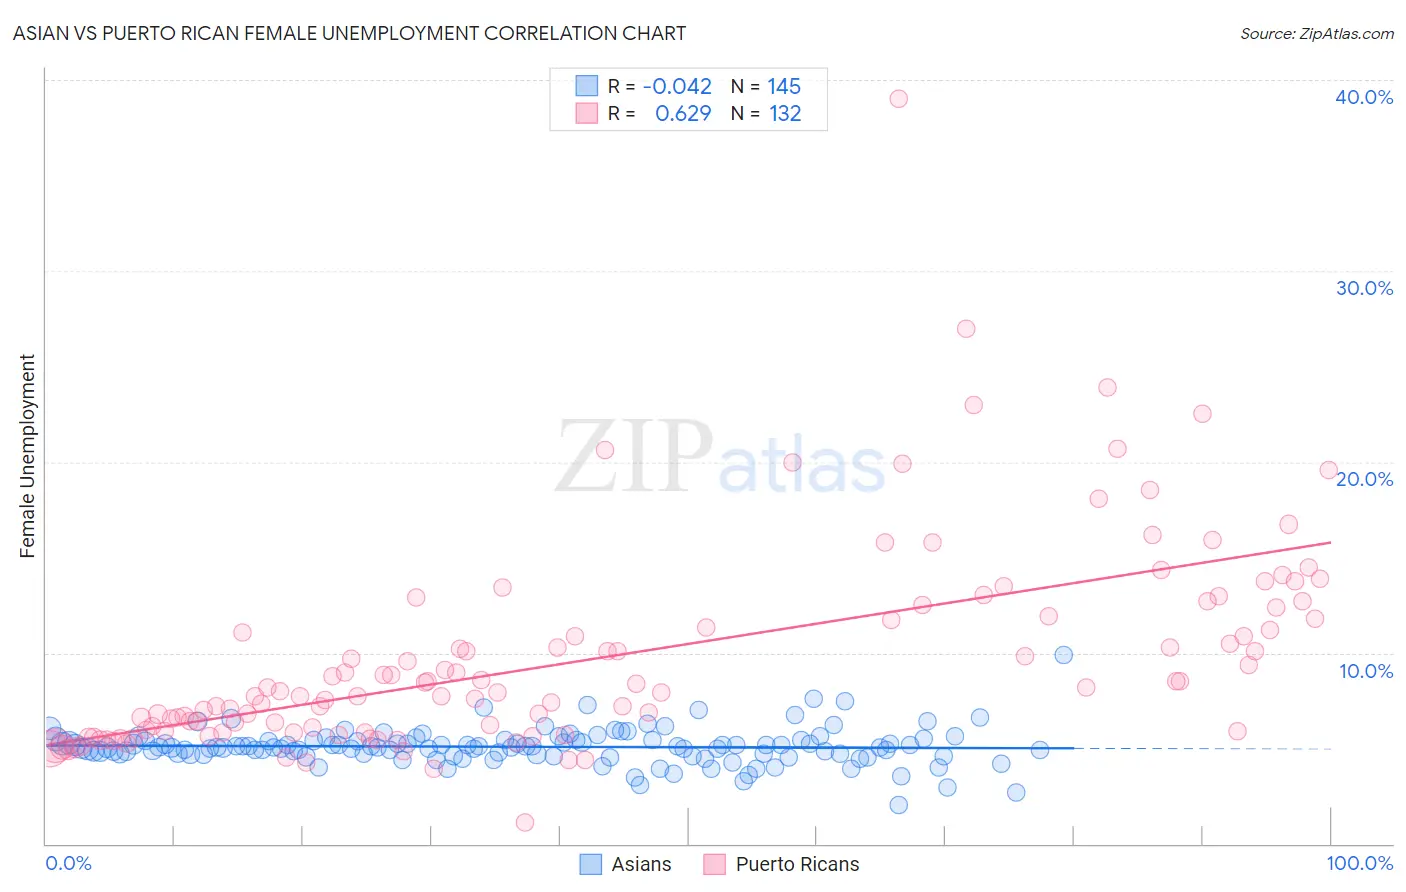
Asian vs Puerto Rican Female Unemployment Correlation Chart
The statistical analysis conducted on geographies consisting of 542,084,939 people shows no correlation between the proportion of Asians and unemploymnet rate among females in the United States with a correlation coefficient (R) of -0.042 and weighted average of 5.2%. Similarly, the statistical analysis conducted on geographies consisting of 522,192,067 people shows a significant positive correlation between the proportion of Puerto Ricans and unemploymnet rate among females in the United States with a correlation coefficient (R) of 0.629 and weighted average of 8.3%, a difference of 61.8%.
Female Unemployment Correlation Summary
| Measurement | Asian | Puerto Rican |
| Minimum | 2.0% | 1.1% |
| Maximum | 9.9% | 39.0% |
| Range | 7.9% | 37.9% |
| Mean | 5.1% | 9.7% |
| Median | 5.0% | 8.1% |
| Interquartile 25% (IQ1) | 4.7% | 5.9% |
| Interquartile 75% (IQ3) | 5.4% | 11.8% |
| Interquartile Range (IQR) | 0.72% | 5.9% |
| Standard Deviation (Sample) | 0.94% | 5.4% |
| Standard Deviation (Population) | 0.94% | 5.4% |
Similar Demographics by Female Unemployment
Demographics Similar to Asians by Female Unemployment
In terms of female unemployment, the demographic groups most similar to Asians are Egyptian (5.2%, a difference of 0.010%), Immigrants from Argentina (5.2%, a difference of 0.030%), Argentinean (5.2%, a difference of 0.080%), Immigrants from Norway (5.2%, a difference of 0.10%), and Immigrants from Oceania (5.2%, a difference of 0.11%).
| Demographics | Rating | Rank | Female Unemployment |
| Palestinians | 80.8 /100 | #142 | Excellent 5.1% |
| Immigrants | Kazakhstan | 80.7 /100 | #143 | Excellent 5.1% |
| Immigrants | Jordan | 80.4 /100 | #144 | Excellent 5.1% |
| Immigrants | Oceania | 79.5 /100 | #145 | Good 5.2% |
| Immigrants | Norway | 79.4 /100 | #146 | Good 5.2% |
| Argentineans | 79.2 /100 | #147 | Good 5.2% |
| Immigrants | Argentina | 78.7 /100 | #148 | Good 5.2% |
| Asians | 78.3 /100 | #149 | Good 5.2% |
| Egyptians | 78.3 /100 | #150 | Good 5.2% |
| Immigrants | China | 75.9 /100 | #151 | Good 5.2% |
| Immigrants | Italy | 75.0 /100 | #152 | Good 5.2% |
| Immigrants | Greece | 74.9 /100 | #153 | Good 5.2% |
| South Africans | 70.8 /100 | #154 | Good 5.2% |
| Immigrants | Egypt | 70.0 /100 | #155 | Good 5.2% |
| Immigrants | Northern Africa | 69.6 /100 | #156 | Good 5.2% |
Demographics Similar to Puerto Ricans by Female Unemployment
In terms of female unemployment, the demographic groups most similar to Puerto Ricans are Inupiat (8.2%, a difference of 2.2%), Hopi (8.1%, a difference of 3.0%), Arapaho (8.8%, a difference of 5.4%), Immigrants from Yemen (7.8%, a difference of 6.4%), and Tohono O'odham (7.7%, a difference of 7.7%).
| Demographics | Rating | Rank | Female Unemployment |
| Menominee | 0.0 /100 | #333 | Tragic 7.0% |
| Immigrants | Armenia | 0.0 /100 | #334 | Tragic 7.1% |
| Dominicans | 0.0 /100 | #335 | Tragic 7.2% |
| Immigrants | Dominican Republic | 0.0 /100 | #336 | Tragic 7.2% |
| Navajo | 0.0 /100 | #337 | Tragic 7.3% |
| Tohono O'odham | 0.0 /100 | #338 | Tragic 7.7% |
| Immigrants | Yemen | 0.0 /100 | #339 | Tragic 7.8% |
| Hopi | 0.0 /100 | #340 | Tragic 8.1% |
| Inupiat | 0.0 /100 | #341 | Tragic 8.2% |
| Puerto Ricans | 0.0 /100 | #342 | Tragic 8.3% |
| Arapaho | 0.0 /100 | #343 | Tragic 8.8% |
| Pima | 0.0 /100 | #344 | Tragic 9.3% |
| Yuman | 0.0 /100 | #345 | Tragic 9.6% |
| Yup'ik | 0.0 /100 | #346 | Tragic 10.9% |
| Crow | 0.0 /100 | #347 | Tragic 12.1% |