Asian vs Puerto Rican Professional Degree
COMPARE
Asian
Puerto Rican
Professional Degree
Professional Degree Comparison
Asians
Puerto Ricans
5.5%
PROFESSIONAL DEGREE
99.9/ 100
METRIC RATING
63rd/ 347
METRIC RANK
3.2%
PROFESSIONAL DEGREE
0.1/ 100
METRIC RATING
316th/ 347
METRIC RANK
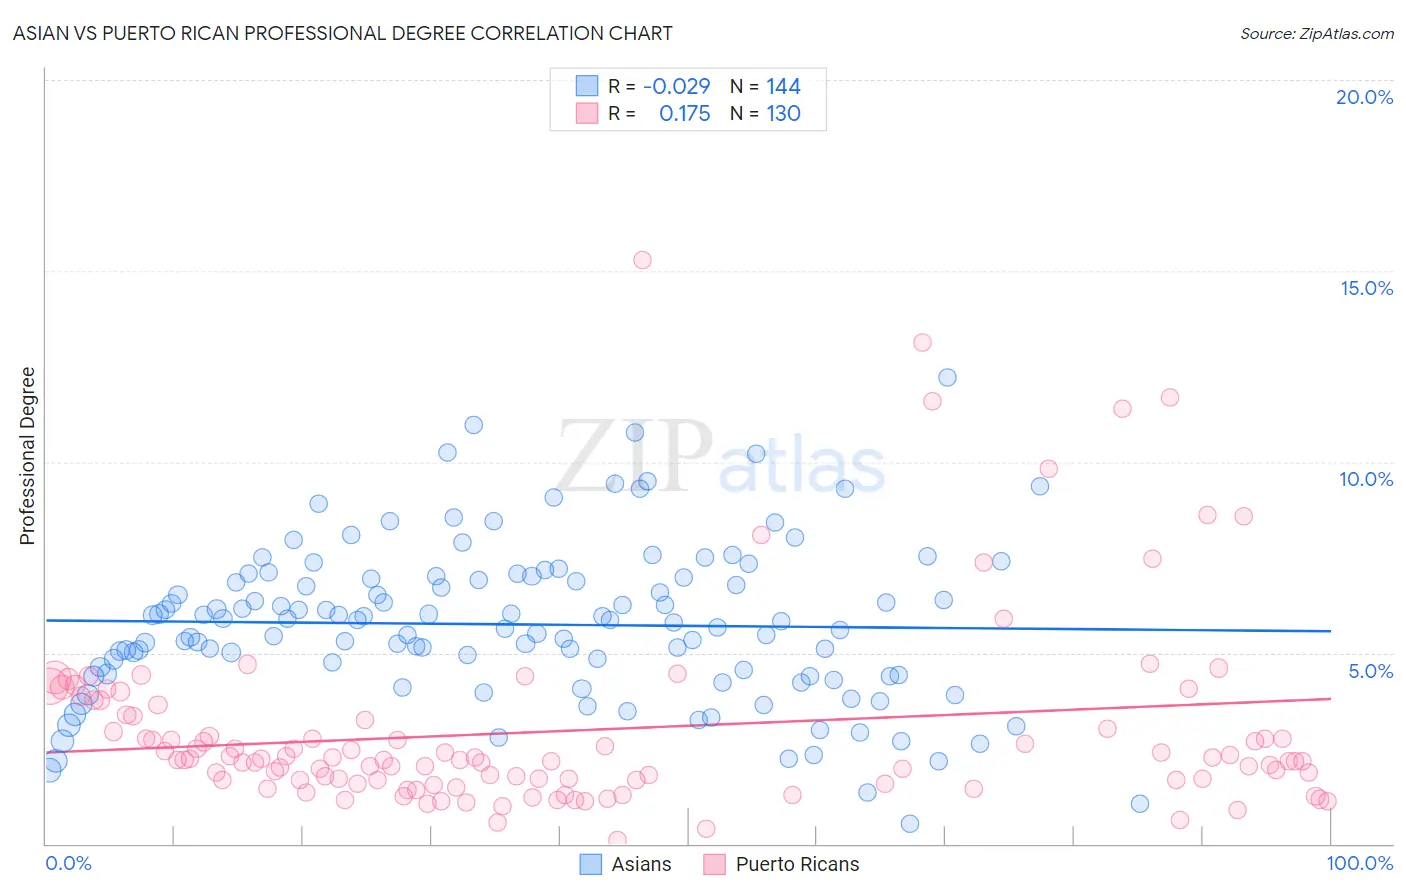
Asian vs Puerto Rican Professional Degree Correlation Chart
The statistical analysis conducted on geographies consisting of 546,309,051 people shows no correlation between the proportion of Asians and percentage of population with at least professional degree education in the United States with a correlation coefficient (R) of -0.029 and weighted average of 5.5%. Similarly, the statistical analysis conducted on geographies consisting of 524,505,340 people shows a poor positive correlation between the proportion of Puerto Ricans and percentage of population with at least professional degree education in the United States with a correlation coefficient (R) of 0.175 and weighted average of 3.2%, a difference of 69.8%.
Professional Degree Correlation Summary
| Measurement | Asian | Puerto Rican |
| Minimum | 0.52% | 0.087% |
| Maximum | 12.2% | 15.3% |
| Range | 11.7% | 15.2% |
| Mean | 5.7% | 3.0% |
| Median | 5.8% | 2.2% |
| Interquartile 25% (IQ1) | 4.4% | 1.7% |
| Interquartile 75% (IQ3) | 7.0% | 3.3% |
| Interquartile Range (IQR) | 2.6% | 1.7% |
| Standard Deviation (Sample) | 2.1% | 2.6% |
| Standard Deviation (Population) | 2.1% | 2.5% |
Similar Demographics by Professional Degree
Demographics Similar to Asians by Professional Degree
In terms of professional degree, the demographic groups most similar to Asians are Immigrants from Asia (5.5%, a difference of 0.060%), Immigrants from Bolivia (5.5%, a difference of 0.13%), Immigrants from Kazakhstan (5.5%, a difference of 0.36%), Immigrants from Belarus (5.5%, a difference of 0.43%), and Immigrants from Bulgaria (5.5%, a difference of 0.69%).
| Demographics | Rating | Rank | Professional Degree |
| Immigrants | Malaysia | 100.0 /100 | #56 | Exceptional 5.7% |
| South Africans | 100.0 /100 | #57 | Exceptional 5.7% |
| Bulgarians | 100.0 /100 | #58 | Exceptional 5.7% |
| Immigrants | Europe | 100.0 /100 | #59 | Exceptional 5.6% |
| Bolivians | 99.9 /100 | #60 | Exceptional 5.6% |
| Immigrants | Lithuania | 99.9 /100 | #61 | Exceptional 5.6% |
| Immigrants | Belarus | 99.9 /100 | #62 | Exceptional 5.5% |
| Asians | 99.9 /100 | #63 | Exceptional 5.5% |
| Immigrants | Asia | 99.9 /100 | #64 | Exceptional 5.5% |
| Immigrants | Bolivia | 99.9 /100 | #65 | Exceptional 5.5% |
| Immigrants | Kazakhstan | 99.9 /100 | #66 | Exceptional 5.5% |
| Immigrants | Bulgaria | 99.9 /100 | #67 | Exceptional 5.5% |
| Immigrants | Lebanon | 99.9 /100 | #68 | Exceptional 5.5% |
| Immigrants | Hungary | 99.9 /100 | #69 | Exceptional 5.5% |
| Bhutanese | 99.8 /100 | #70 | Exceptional 5.4% |
Demographics Similar to Puerto Ricans by Professional Degree
In terms of professional degree, the demographic groups most similar to Puerto Ricans are Immigrants from Laos (3.2%, a difference of 0.010%), Nepalese (3.2%, a difference of 0.21%), Immigrants from Micronesia (3.2%, a difference of 0.24%), Choctaw (3.2%, a difference of 0.48%), and Mexican American Indian (3.3%, a difference of 0.69%).
| Demographics | Rating | Rank | Professional Degree |
| Pima | 0.1 /100 | #309 | Tragic 3.3% |
| Immigrants | Latin America | 0.1 /100 | #310 | Tragic 3.3% |
| Cherokee | 0.1 /100 | #311 | Tragic 3.3% |
| Sioux | 0.1 /100 | #312 | Tragic 3.3% |
| Yuman | 0.1 /100 | #313 | Tragic 3.3% |
| Mexican American Indians | 0.1 /100 | #314 | Tragic 3.3% |
| Immigrants | Laos | 0.1 /100 | #315 | Tragic 3.2% |
| Puerto Ricans | 0.1 /100 | #316 | Tragic 3.2% |
| Nepalese | 0.1 /100 | #317 | Tragic 3.2% |
| Immigrants | Micronesia | 0.1 /100 | #318 | Tragic 3.2% |
| Choctaw | 0.1 /100 | #319 | Tragic 3.2% |
| Seminole | 0.1 /100 | #320 | Tragic 3.2% |
| Tsimshian | 0.0 /100 | #321 | Tragic 3.2% |
| Hispanics or Latinos | 0.0 /100 | #322 | Tragic 3.2% |
| Inupiat | 0.0 /100 | #323 | Tragic 3.2% |