Immigrants from Cabo Verde vs Immigrants from Senegal Unemployment Among Ages 20 to 24 years
COMPARE
Immigrants from Cabo Verde
Immigrants from Senegal
Unemployment Among Ages 20 to 24 years
Unemployment Among Ages 20 to 24 years Comparison
Immigrants from Cabo Verde
Immigrants from Senegal
12.2%
UNEMPLOYMENT AMONG AGES 20 TO 24 YEARS
0.0/ 100
METRIC RATING
302nd/ 347
METRIC RANK
11.9%
UNEMPLOYMENT AMONG AGES 20 TO 24 YEARS
0.0/ 100
METRIC RATING
292nd/ 347
METRIC RANK
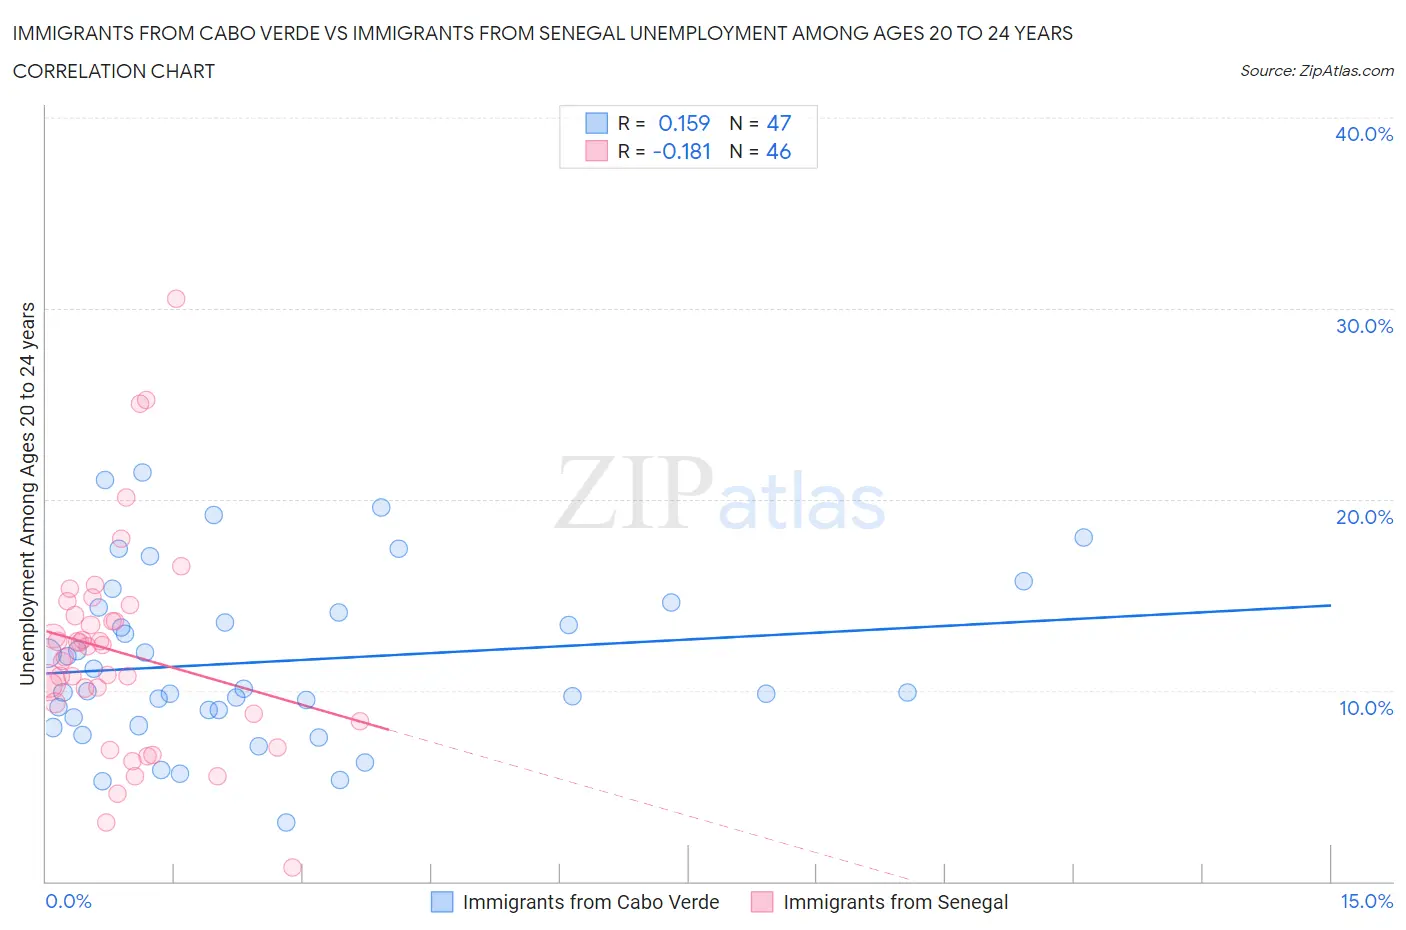
Immigrants from Cabo Verde vs Immigrants from Senegal Unemployment Among Ages 20 to 24 years Correlation Chart
The statistical analysis conducted on geographies consisting of 37,888,752 people shows a poor positive correlation between the proportion of Immigrants from Cabo Verde and unemployment rate among population between the ages 20 and 24 in the United States with a correlation coefficient (R) of 0.159 and weighted average of 12.2%. Similarly, the statistical analysis conducted on geographies consisting of 89,868,284 people shows a poor negative correlation between the proportion of Immigrants from Senegal and unemployment rate among population between the ages 20 and 24 in the United States with a correlation coefficient (R) of -0.181 and weighted average of 11.9%, a difference of 2.5%.
Unemployment Among Ages 20 to 24 years Correlation Summary
| Measurement | Immigrants from Cabo Verde | Immigrants from Senegal |
| Minimum | 3.1% | 0.70% |
| Maximum | 21.4% | 30.5% |
| Range | 18.3% | 29.8% |
| Mean | 11.5% | 12.0% |
| Median | 10.0% | 12.0% |
| Interquartile 25% (IQ1) | 8.6% | 8.8% |
| Interquartile 75% (IQ3) | 14.4% | 13.9% |
| Interquartile Range (IQR) | 5.8% | 5.1% |
| Standard Deviation (Sample) | 4.4% | 5.6% |
| Standard Deviation (Population) | 4.4% | 5.5% |
Demographics Similar to Immigrants from Cabo Verde and Immigrants from Senegal by Unemployment Among Ages 20 to 24 years
In terms of unemployment among ages 20 to 24 years, the demographic groups most similar to Immigrants from Cabo Verde are Haitian (12.2%, a difference of 0.020%), Immigrants from West Indies (12.3%, a difference of 0.61%), Chippewa (12.3%, a difference of 0.65%), Immigrants from Sierra Leone (12.1%, a difference of 0.85%), and Spanish American Indian (12.1%, a difference of 1.3%). Similarly, the demographic groups most similar to Immigrants from Senegal are Central American Indian (11.9%, a difference of 0.080%), Immigrants from Ghana (11.9%, a difference of 0.23%), Immigrants from Belize (12.0%, a difference of 0.26%), Immigrants from Armenia (12.0%, a difference of 0.44%), and Cajun (12.0%, a difference of 0.47%).
| Demographics | Rating | Rank | Unemployment Among Ages 20 to 24 years |
| Immigrants | Ecuador | 0.0 /100 | #287 | Tragic 11.8% |
| U.S. Virgin Islanders | 0.0 /100 | #288 | Tragic 11.8% |
| Belizeans | 0.0 /100 | #289 | Tragic 11.8% |
| Immigrants | Caribbean | 0.0 /100 | #290 | Tragic 11.8% |
| Central American Indians | 0.0 /100 | #291 | Tragic 11.9% |
| Immigrants | Senegal | 0.0 /100 | #292 | Tragic 11.9% |
| Immigrants | Ghana | 0.0 /100 | #293 | Tragic 11.9% |
| Immigrants | Belize | 0.0 /100 | #294 | Tragic 12.0% |
| Immigrants | Armenia | 0.0 /100 | #295 | Tragic 12.0% |
| Cajuns | 0.0 /100 | #296 | Tragic 12.0% |
| Blackfeet | 0.0 /100 | #297 | Tragic 12.0% |
| Lumbee | 0.0 /100 | #298 | Tragic 12.0% |
| Apache | 0.0 /100 | #299 | Tragic 12.0% |
| Spanish American Indians | 0.0 /100 | #300 | Tragic 12.1% |
| Immigrants | Sierra Leone | 0.0 /100 | #301 | Tragic 12.1% |
| Immigrants | Cabo Verde | 0.0 /100 | #302 | Tragic 12.2% |
| Haitians | 0.0 /100 | #303 | Tragic 12.2% |
| Immigrants | West Indies | 0.0 /100 | #304 | Tragic 12.3% |
| Chippewa | 0.0 /100 | #305 | Tragic 12.3% |
| Immigrants | Haiti | 0.0 /100 | #306 | Tragic 12.4% |
| Bermudans | 0.0 /100 | #307 | Tragic 12.5% |