South African vs Hawaiian Unemployment Among Women with Children Ages 6 to 17 years

COMPARE

South African
Race
Ancestry
AfghanAfricanAlaska NativeAlaskan AthabascanAlbanianAleutAlsatianAmericanApacheArabArapahoArgentineanArmenianAssyrian/Chaldean/SyriacAustralianAustrianBahamianBangladeshiBarbadianBasqueBelgianBelizeanBermudanBhutaneseBlackfeetBolivianBrazilianBritishBritish West IndianBulgarianBurmeseCajunCambodianCanadianCape VerdeanCarpatho RusynCelticCentral AmericanCentral American IndianCherokeeCheyenneChickasawChileanChineseChippewaChoctawColombianColvilleComancheCosta RicanCreeCreekCroatianCrowCubanCypriotCzechCzechoslovakianDanishDelawareDominicanDutchDutch West IndianEastern EuropeanEcuadorianEgyptianEnglishEstonianEthiopianEuropeanFijianFilipinoFinnishFrenchFrench American IndianFrench CanadianGermanGerman RussianGhanaianGreekGuamanian/ChamorroGuatemalanGuyaneseHaitianHmongHonduranHopiHoumaHungarianIcelanderIndian (Asian)IndonesianInupiatIranianIraqiIrishIroquoisIsraeliItalianJamaicanJapaneseJordanianKenyanKiowaKoreanLaotianLatvianLebaneseLiberianLithuanianLumbeeLuxembourgerMacedonianMalaysianMalteseMarshalleseMenomineeMexicanMexican American IndianMongolianMoroccanNative HawaiianNavajoNepaleseNew ZealanderNicaraguanNigerianNorthern EuropeanNorwegianOkinawanOsageOttawaPaiutePakistaniPalestinianPanamanianParaguayanPennsylvania GermanPeruvianPimaPolishPortuguesePotawatomiPuebloPuerto RicanPuget Sound SalishRomanianRussianSalvadoranSamoanScandinavianScotch-IrishScottishSeminoleSenegaleseSerbianShoshoneSierra LeoneanSiouxSlavicSlovakSloveneSomaliSouth AfricanSouth AmericanSouth American IndianSoviet UnionSpaniardSpanishSpanish AmericanSpanish American IndianSri LankanSubsaharan AfricanSudaneseSwedishSwissSyrianTaiwaneseThaiTlingit-HaidaTohono O'OdhamTonganTrinidadian and TobagonianTsimshianTurkishU.S. Virgin IslanderUgandanUkrainianUruguayanUteVenezuelanVietnameseWelshWest IndianYakamaYaquiYugoslavianYumanYup'ikZimbabwean
Immigration
NonimmigrantsImmigrantsAfghanistanAfricaAlbaniaArgentinaArmeniaAsiaAustraliaAustriaBahamasBangladeshBarbadosBelarusBelgiumBelizeBoliviaBosnia and HerzegovinaBrazilBulgariaBurma/MyanmarCabo VerdeCambodiaCameroonCanadaCaribbeanCentral AmericaChileChinaColombiaCongoCosta RicaCroatiaCubaCzechoslovakiaDenmarkDominicaDominican RepublicEastern AfricaEastern AsiaEastern EuropeEcuadorEgyptEl SalvadorEnglandEritreaEthiopiaEuropeFijiFranceGermanyGhanaGreeceGrenadaGuatemalaGuyanaHaitiHondurasHong KongHungaryIndiaIndonesiaIranIraqIrelandIsraelItalyJamaicaJapanJordanKazakhstanKenyaKoreaKuwaitLaosLatin AmericaLatviaLebanonLiberiaLithuaniaMalaysiaMexicoMicronesiaMiddle AfricaMoldovaMoroccoNepalNetherlandsNicaraguaNigeriaNorth AmericaNorth MacedoniaNorthern AfricaNorthern EuropeNorwayOceaniaPakistanPanamaPeruPhilippinesPolandPortugalRomaniaRussiaSaudi ArabiaScotlandSenegalSerbiaSierra LeoneSingaporeSomaliaSouth AfricaSouth AmericaSouth Central AsiaSouth Eastern AsiaSouthern EuropeSpainSri LankaSt. Vincent and the GrenadinesSudanSwedenSwitzerlandSyriaTaiwanThailandTrinidad and TobagoTurkeyUgandaUkraineUruguayUzbekistanVenezuelaVietnamWest IndiesWestern AfricaWestern AsiaWestern EuropeYemenZaireZimbabweAzores
Hawaiian
Race
Ancestry
AfghanAfricanAlaska NativeAlaskan AthabascanAlbanianAleutAlsatianAmericanApacheArabArapahoArgentineanArmenianAssyrian/Chaldean/SyriacAustralianAustrianBahamianBangladeshiBarbadianBasqueBelgianBelizeanBermudanBhutaneseBlackfeetBolivianBrazilianBritishBritish West IndianBulgarianBurmeseCajunCambodianCanadianCape VerdeanCarpatho RusynCelticCentral AmericanCentral American IndianCherokeeCheyenneChickasawChileanChineseChippewaChoctawColombianColvilleComancheCosta RicanCreeCreekCroatianCrowCubanCypriotCzechCzechoslovakianDanishDelawareDominicanDutchDutch West IndianEastern EuropeanEcuadorianEgyptianEnglishEstonianEthiopianEuropeanFijianFilipinoFinnishFrenchFrench American IndianFrench CanadianGermanGerman RussianGhanaianGreekGuamanian/ChamorroGuatemalanGuyaneseHaitianHmongHonduranHopiHoumaHungarianIcelanderIndian (Asian)IndonesianInupiatIranianIraqiIrishIroquoisIsraeliItalianJamaicanJapaneseJordanianKenyanKiowaKoreanLaotianLatvianLebaneseLiberianLithuanianLumbeeLuxembourgerMacedonianMalaysianMalteseMarshalleseMenomineeMexicanMexican American IndianMongolianMoroccanNative HawaiianNavajoNepaleseNew ZealanderNicaraguanNigerianNorthern EuropeanNorwegianOkinawanOsageOttawaPaiutePakistaniPalestinianPanamanianParaguayanPennsylvania GermanPeruvianPimaPolishPortuguesePotawatomiPuebloPuerto RicanPuget Sound SalishRomanianRussianSalvadoranSamoanScandinavianScotch-IrishScottishSeminoleSenegaleseSerbianShoshoneSierra LeoneanSiouxSlavicSlovakSloveneSomaliSouth AmericanSouth American IndianSoviet UnionSpaniardSpanishSpanish AmericanSpanish American IndianSri LankanSubsaharan AfricanSudaneseSwedishSwissSyrianTaiwaneseThaiTlingit-HaidaTohono O'OdhamTonganTrinidadian and TobagonianTsimshianTurkishU.S. Virgin IslanderUgandanUkrainianUruguayanUteVenezuelanVietnameseWelshWest IndianYakamaYaquiYugoslavianYumanYup'ikZimbabwean
Immigration
NonimmigrantsImmigrantsAfghanistanAfricaAlbaniaArgentinaArmeniaAsiaAustraliaAustriaBahamasBangladeshBarbadosBelarusBelgiumBelizeBoliviaBosnia and HerzegovinaBrazilBulgariaBurma/MyanmarCabo VerdeCambodiaCameroonCanadaCaribbeanCentral AmericaChileChinaColombiaCongoCosta RicaCroatiaCubaCzechoslovakiaDenmarkDominicaDominican RepublicEastern AfricaEastern AsiaEastern EuropeEcuadorEgyptEl SalvadorEnglandEritreaEthiopiaEuropeFijiFranceGermanyGhanaGreeceGrenadaGuatemalaGuyanaHaitiHondurasHong KongHungaryIndiaIndonesiaIranIraqIrelandIsraelItalyJamaicaJapanJordanKazakhstanKenyaKoreaKuwaitLaosLatin AmericaLatviaLebanonLiberiaLithuaniaMalaysiaMexicoMicronesiaMiddle AfricaMoldovaMoroccoNepalNetherlandsNicaraguaNigeriaNorth AmericaNorth MacedoniaNorthern AfricaNorthern EuropeNorwayOceaniaPakistanPanamaPeruPhilippinesPolandPortugalRomaniaRussiaSaudi ArabiaScotlandSenegalSerbiaSierra LeoneSingaporeSomaliaSouth AfricaSouth AmericaSouth Central AsiaSouth Eastern AsiaSouthern EuropeSpainSri LankaSt. Vincent and the GrenadinesSudanSwedenSwitzerlandSyriaTaiwanThailandTrinidad and TobagoTurkeyUgandaUkraineUruguayUzbekistanVenezuelaVietnamWest IndiesWestern AfricaWestern AsiaWestern EuropeYemenZaireZimbabweAzores
Unemployment Among Women with Children Ages 6 to 17 years
Income
Poverty
Unemployment
Labor Participation
Family Structure
Vehicle Availability
Education Level
Disability

Unemployment Among Women with Children Ages 6 to 17 years Comparison

South Africans

Hawaiians

Exceptional
Exceptional
8.7%
UNEMPLOYMENT AMONG WOMEN WITH CHILDREN AGES 6 TO 17 YEARS
94.6/ 100
METRIC RATING
125th/ 347
METRIC RANK
8.1%
UNEMPLOYMENT AMONG WOMEN WITH CHILDREN AGES 6 TO 17 YEARS
100.0/ 100
METRIC RATING
50th/ 347
METRIC RANK

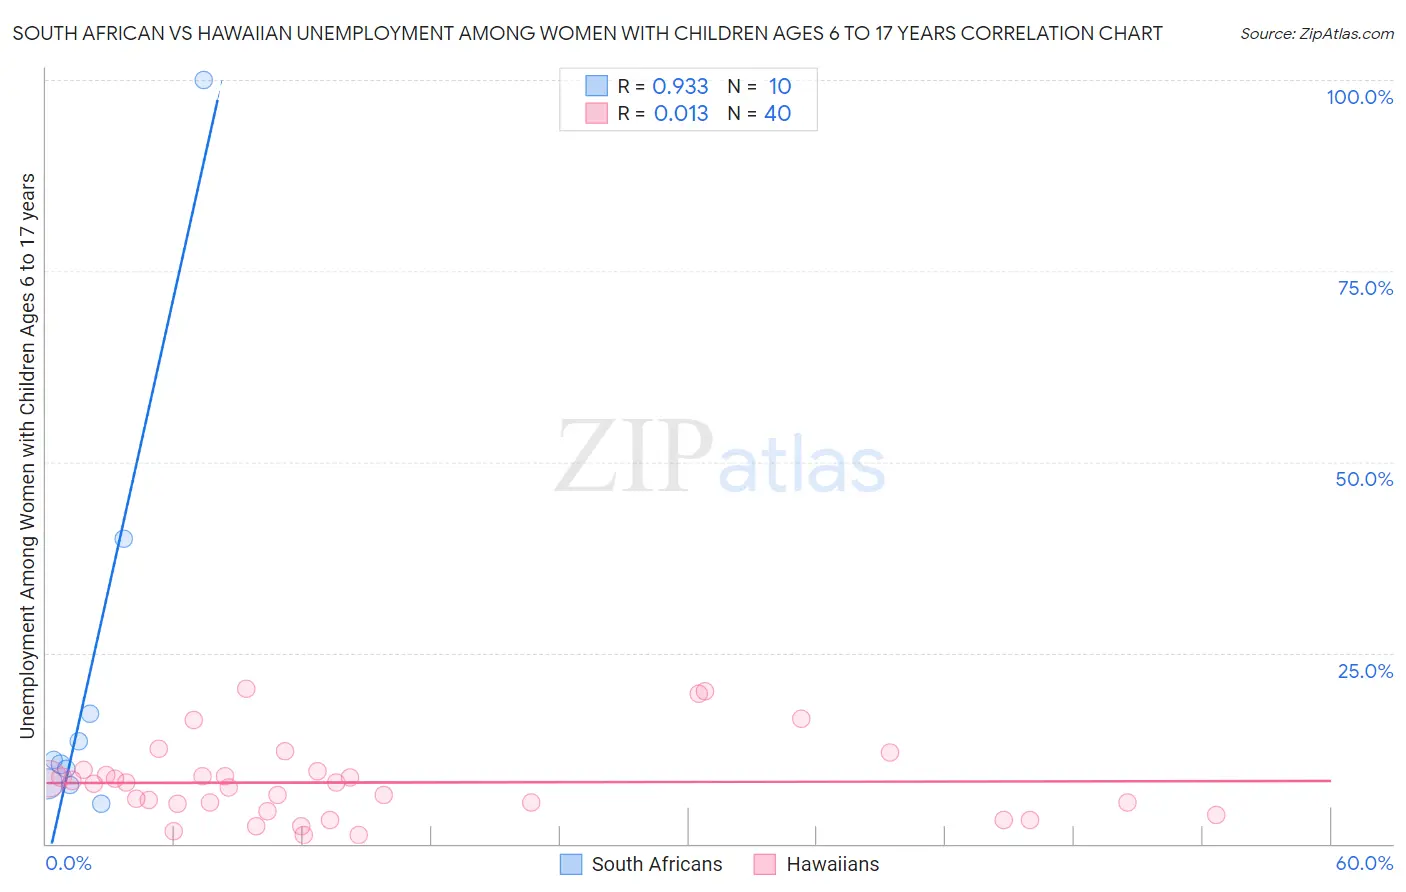
South African vs Hawaiian Unemployment Among Women with Children Ages 6 to 17 years Correlation Chart

The statistical analysis conducted on geographies consisting of 145,059,046 people shows a near-perfect positive correlation between the proportion of South Africans and unemployment rate among women with children between the ages 6 and 17 in the United States with a correlation coefficient (R) of 0.933 and weighted average of 8.7%. Similarly, the statistical analysis conducted on geographies consisting of 248,677,596 people shows no correlation between the proportion of Hawaiians and unemployment rate among women with children between the ages 6 and 17 in the United States with a correlation coefficient (R) of 0.013 and weighted average of 8.1%, a difference of 7.3%.
South African vs Hawaiian Unemployment Among Women with Children Ages 6 to 17 years

Unemployment Among Women with Children Ages 6 to 17 years Correlation Summary

MeasurementSouth AfricanHawaiian
Minimum5.3%1.1%
Maximum100.0%20.3%
Range94.7%19.2%
Mean22.3%8.0%
Median10.7%7.9%
Interquartile 25% (IQ1)7.9%4.8%
Interquartile 75% (IQ3)17.0%9.3%
Interquartile Range (IQR)9.1%4.5%
Standard Deviation (Sample)29.0%5.0%
Standard Deviation (Population)27.6%4.9%

Similar Demographics by Unemployment Among Women with Children Ages 6 to 17 years

Demographics Similar to South Africans by Unemployment Among Women with Children Ages 6 to 17 years

In terms of unemployment among women with children ages 6 to 17 years, the demographic groups most similar to South Africans are Immigrants from Northern Africa (8.7%, a difference of 0.030%), Czech (8.7%, a difference of 0.030%), Hmong (8.7%, a difference of 0.050%), Immigrants from Morocco (8.7%, a difference of 0.070%), and Immigrants from Lebanon (8.7%, a difference of 0.070%).
DemographicsRating | RankUnemployment Among Women with Children Ages 6 to 17 years
Pueblo
96.2
/100
|
#118
Exceptional
8.6%
Immigrants | Grenada
96.2
/100
|
#119
Exceptional
8.6%
Israelis
95.9
/100
|
#120
Exceptional
8.7%
Immigrants | Denmark
95.5
/100
|
#121
Exceptional
8.7%
Immigrants | Egypt
95.0
/100
|
#122
Exceptional
8.7%
Immigrants | Morocco
94.9
/100
|
#123
Exceptional
8.7%
Immigrants | Lebanon
94.9
/100
|
#124
Exceptional
8.7%
South Africans
94.6
/100
|
#125
Exceptional
8.7%
Immigrants | Northern Africa
94.4
/100
|
#126
Exceptional
8.7%
Czechs
94.4
/100
|
#127
Exceptional
8.7%
Hmong
94.3
/100
|
#128
Exceptional
8.7%
Barbadians
93.8
/100
|
#129
Exceptional
8.7%
Immigrants | Western Asia
93.1
/100
|
#130
Exceptional
8.7%
Slavs
92.2
/100
|
#131
Exceptional
8.7%
Yaqui
92.2
/100
|
#132
Exceptional
8.7%

Demographics Similar to Hawaiians by Unemployment Among Women with Children Ages 6 to 17 years

In terms of unemployment among women with children ages 6 to 17 years, the demographic groups most similar to Hawaiians are Immigrants from Oceania (8.1%, a difference of 0.11%), Immigrants from Asia (8.1%, a difference of 0.16%), Immigrants from Sudan (8.1%, a difference of 0.18%), Immigrants from Switzerland (8.1%, a difference of 0.29%), and Icelander (8.1%, a difference of 0.33%).
DemographicsRating | RankUnemployment Among Women with Children Ages 6 to 17 years
Bhutanese
100.0
/100
|
#43
Exceptional
8.1%
Immigrants | Sweden
100.0
/100
|
#44
Exceptional
8.1%
Immigrants | Bulgaria
100.0
/100
|
#45
Exceptional
8.1%
Icelanders
100.0
/100
|
#46
Exceptional
8.1%
Immigrants | Switzerland
100.0
/100
|
#47
Exceptional
8.1%
Immigrants | Asia
100.0
/100
|
#48
Exceptional
8.1%
Immigrants | Oceania
100.0
/100
|
#49
Exceptional
8.1%
Hawaiians
100.0
/100
|
#50
Exceptional
8.1%
Immigrants | Sudan
100.0
/100
|
#51
Exceptional
8.1%
Immigrants | Iraq
100.0
/100
|
#52
Exceptional
8.1%
Danes
100.0
/100
|
#53
Exceptional
8.1%
Immigrants | Armenia
100.0
/100
|
#54
Exceptional
8.2%
Immigrants | Japan
100.0
/100
|
#55
Exceptional
8.2%
Immigrants | Bosnia and Herzegovina
100.0
/100
|
#56
Exceptional
8.2%
Immigrants | Laos
100.0
/100
|
#57
Exceptional
8.2%