American vs Immigrants from Canada Unemployment Among Women with Children Under 6 years
COMPARE
American
Immigrants from Canada
Unemployment Among Women with Children Under 6 years
Unemployment Among Women with Children Under 6 years Comparison
Americans
Immigrants from Canada
9.3%
UNEMPLOYMENT AMONG WOMEN WITH CHILDREN UNDER 6 YEARS
0.0/ 100
METRIC RATING
313th/ 347
METRIC RANK
7.6%
UNEMPLOYMENT AMONG WOMEN WITH CHILDREN UNDER 6 YEARS
61.6/ 100
METRIC RATING
168th/ 347
METRIC RANK
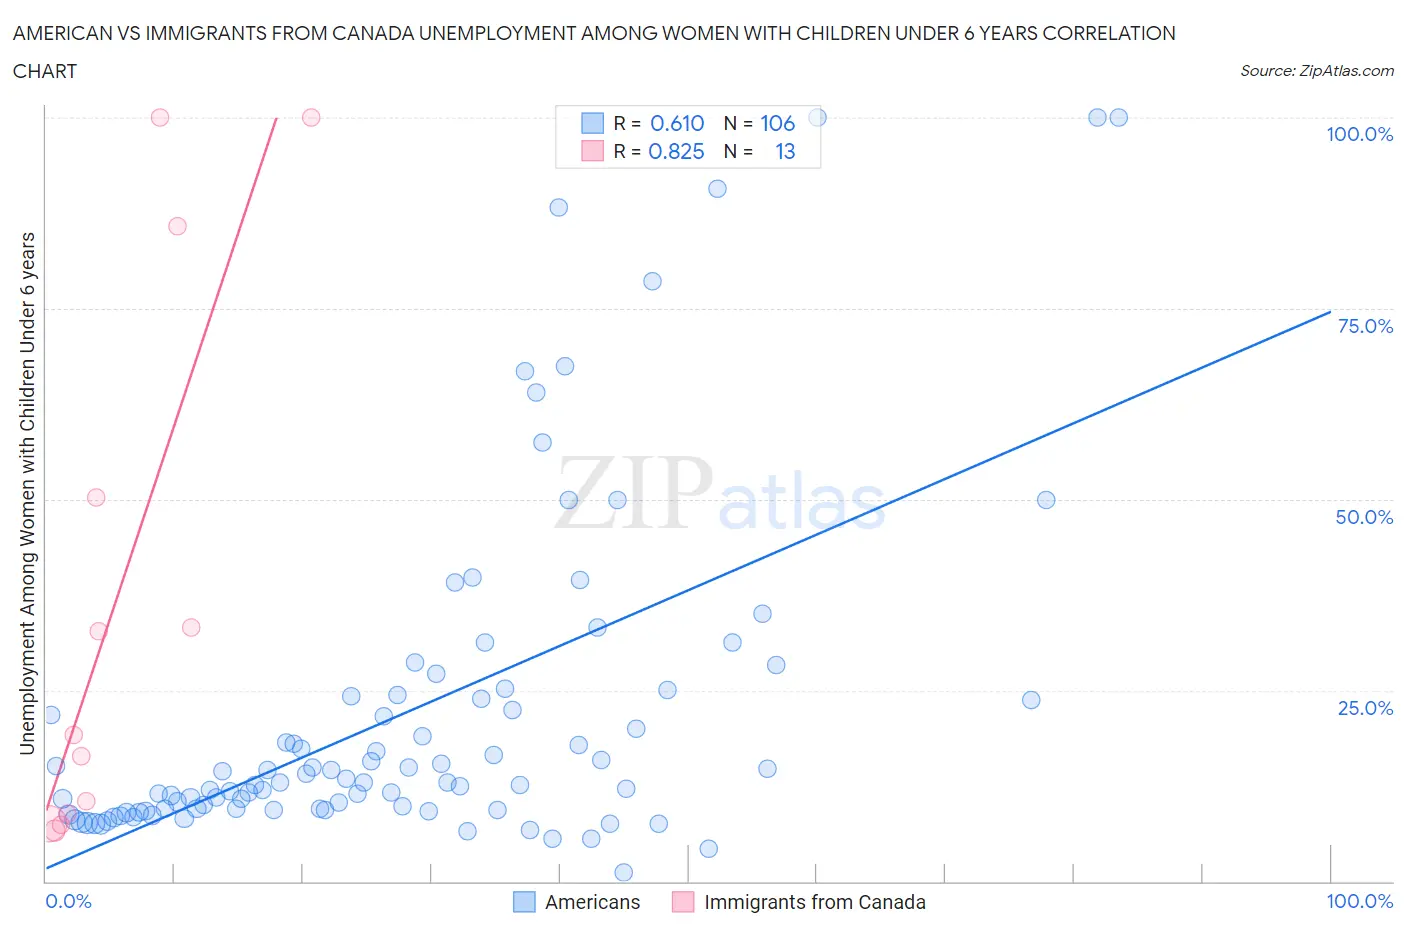
American vs Immigrants from Canada Unemployment Among Women with Children Under 6 years Correlation Chart
The statistical analysis conducted on geographies consisting of 380,925,631 people shows a significant positive correlation between the proportion of Americans and unemployment rate among women with children under the age of 6 in the United States with a correlation coefficient (R) of 0.610 and weighted average of 9.3%. Similarly, the statistical analysis conducted on geographies consisting of 330,910,201 people shows a very strong positive correlation between the proportion of Immigrants from Canada and unemployment rate among women with children under the age of 6 in the United States with a correlation coefficient (R) of 0.825 and weighted average of 7.6%, a difference of 22.0%.
Unemployment Among Women with Children Under 6 years Correlation Summary
| Measurement | American | Immigrants from Canada |
| Minimum | 1.1% | 6.6% |
| Maximum | 100.0% | 100.0% |
| Range | 98.9% | 93.4% |
| Mean | 22.1% | 36.8% |
| Median | 12.9% | 19.1% |
| Interquartile 25% (IQ1) | 9.4% | 8.2% |
| Interquartile 75% (IQ3) | 24.2% | 67.9% |
| Interquartile Range (IQR) | 14.8% | 59.7% |
| Standard Deviation (Sample) | 22.1% | 35.8% |
| Standard Deviation (Population) | 21.9% | 34.4% |
Similar Demographics by Unemployment Among Women with Children Under 6 years
Demographics Similar to Americans by Unemployment Among Women with Children Under 6 years
In terms of unemployment among women with children under 6 years, the demographic groups most similar to Americans are Fijian (9.3%, a difference of 0.030%), Immigrants from the Azores (9.2%, a difference of 0.44%), French American Indian (9.2%, a difference of 0.58%), Cherokee (9.3%, a difference of 0.80%), and Cajun (9.2%, a difference of 0.86%).
| Demographics | Rating | Rank | Unemployment Among Women with Children Under 6 years |
| Pueblo | 0.0 /100 | #306 | Tragic 9.1% |
| Dominicans | 0.0 /100 | #307 | Tragic 9.1% |
| Immigrants | Micronesia | 0.0 /100 | #308 | Tragic 9.1% |
| Africans | 0.0 /100 | #309 | Tragic 9.2% |
| Cajuns | 0.0 /100 | #310 | Tragic 9.2% |
| French American Indians | 0.0 /100 | #311 | Tragic 9.2% |
| Immigrants | Azores | 0.0 /100 | #312 | Tragic 9.2% |
| Americans | 0.0 /100 | #313 | Tragic 9.3% |
| Fijians | 0.0 /100 | #314 | Tragic 9.3% |
| Cherokee | 0.0 /100 | #315 | Tragic 9.3% |
| Houma | 0.0 /100 | #316 | Tragic 9.4% |
| Dutch West Indians | 0.0 /100 | #317 | Tragic 9.5% |
| Osage | 0.0 /100 | #318 | Tragic 9.5% |
| Marshallese | 0.0 /100 | #319 | Tragic 9.6% |
| Potawatomi | 0.0 /100 | #320 | Tragic 9.6% |
Demographics Similar to Immigrants from Canada by Unemployment Among Women with Children Under 6 years
In terms of unemployment among women with children under 6 years, the demographic groups most similar to Immigrants from Canada are Immigrants from Scotland (7.6%, a difference of 0.020%), Kenyan (7.6%, a difference of 0.070%), Czech (7.6%, a difference of 0.12%), Belgian (7.6%, a difference of 0.14%), and Immigrants from Grenada (7.6%, a difference of 0.18%).
| Demographics | Rating | Rank | Unemployment Among Women with Children Under 6 years |
| Immigrants | Western Asia | 70.2 /100 | #161 | Good 7.5% |
| Immigrants | Lithuania | 68.8 /100 | #162 | Good 7.5% |
| British | 66.3 /100 | #163 | Good 7.6% |
| Ugandans | 65.8 /100 | #164 | Good 7.6% |
| Immigrants | South America | 65.6 /100 | #165 | Good 7.6% |
| Belgians | 63.5 /100 | #166 | Good 7.6% |
| Kenyans | 62.5 /100 | #167 | Good 7.6% |
| Immigrants | Canada | 61.6 /100 | #168 | Good 7.6% |
| Immigrants | Scotland | 61.3 /100 | #169 | Good 7.6% |
| Czechs | 59.8 /100 | #170 | Average 7.6% |
| Immigrants | Grenada | 59.0 /100 | #171 | Average 7.6% |
| Immigrants | North America | 57.7 /100 | #172 | Average 7.6% |
| Cree | 51.6 /100 | #173 | Average 7.6% |
| Immigrants | Laos | 50.0 /100 | #174 | Average 7.6% |
| Panamanians | 49.6 /100 | #175 | Average 7.6% |