Immigrants from Sierra Leone vs Cheyenne Unemployment Among Women with Children Under 6 years
COMPARE
Immigrants from Sierra Leone
Cheyenne
Unemployment Among Women with Children Under 6 years
Unemployment Among Women with Children Under 6 years Comparison
Immigrants from Sierra Leone
Cheyenne
8.2%
UNEMPLOYMENT AMONG WOMEN WITH CHILDREN UNDER 6 YEARS
1.1/ 100
METRIC RATING
249th/ 347
METRIC RANK
8.8%
UNEMPLOYMENT AMONG WOMEN WITH CHILDREN UNDER 6 YEARS
0.0/ 100
METRIC RATING
292nd/ 347
METRIC RANK
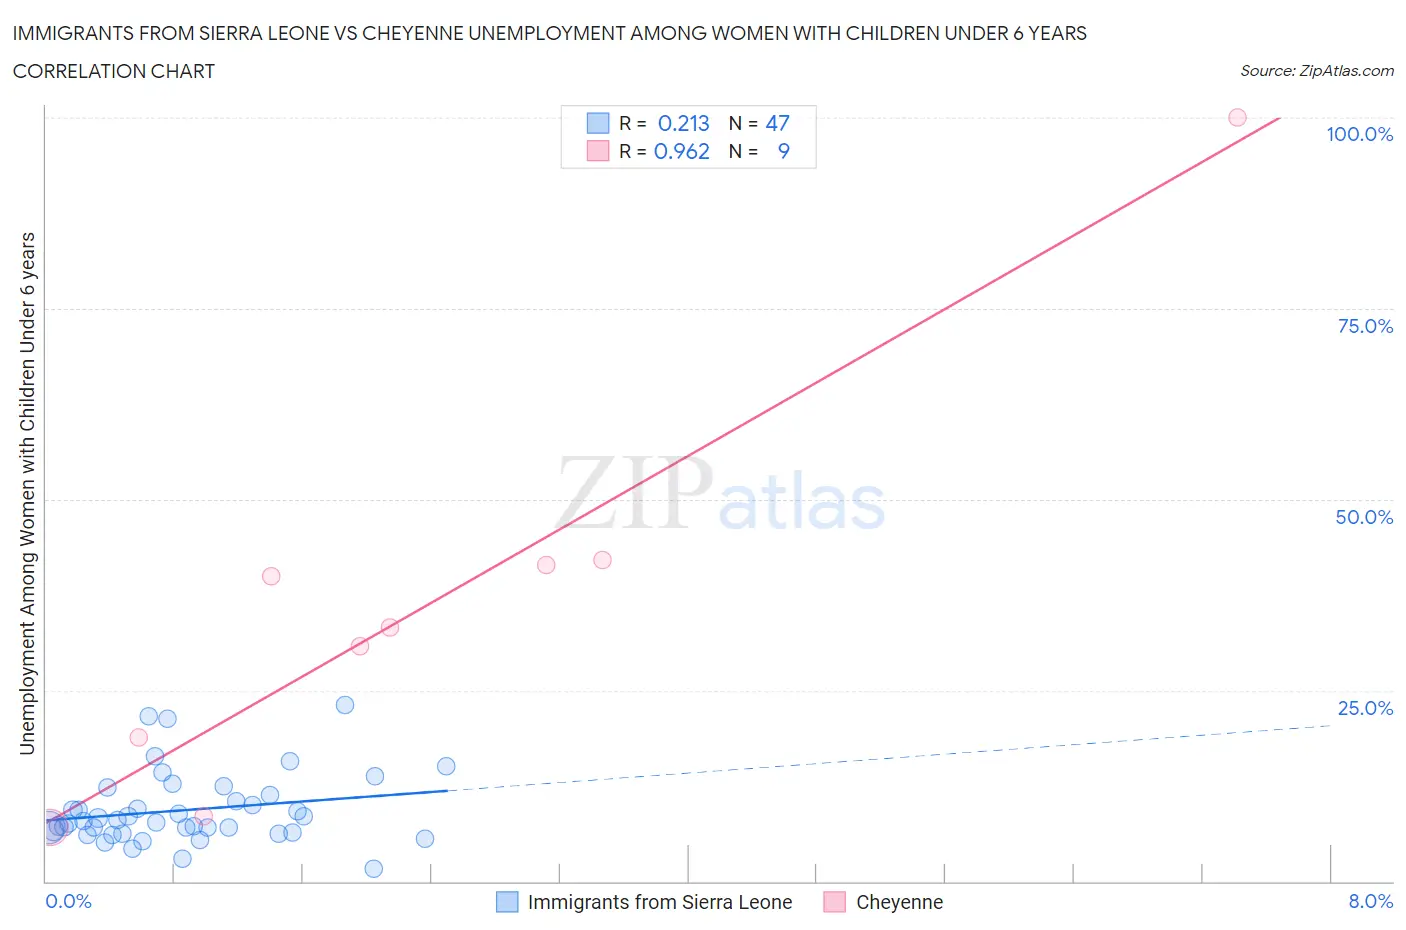
Immigrants from Sierra Leone vs Cheyenne Unemployment Among Women with Children Under 6 years Correlation Chart
The statistical analysis conducted on geographies consisting of 92,718,305 people shows a weak positive correlation between the proportion of Immigrants from Sierra Leone and unemployment rate among women with children under the age of 6 in the United States with a correlation coefficient (R) of 0.213 and weighted average of 8.2%. Similarly, the statistical analysis conducted on geographies consisting of 73,227,790 people shows a perfect positive correlation between the proportion of Cheyenne and unemployment rate among women with children under the age of 6 in the United States with a correlation coefficient (R) of 0.962 and weighted average of 8.8%, a difference of 7.2%.
Unemployment Among Women with Children Under 6 years Correlation Summary
| Measurement | Immigrants from Sierra Leone | Cheyenne |
| Minimum | 1.6% | 7.0% |
| Maximum | 23.1% | 100.0% |
| Range | 21.5% | 93.0% |
| Mean | 9.3% | 35.8% |
| Median | 7.9% | 33.3% |
| Interquartile 25% (IQ1) | 6.3% | 13.7% |
| Interquartile 75% (IQ3) | 11.3% | 41.7% |
| Interquartile Range (IQR) | 5.0% | 28.0% |
| Standard Deviation (Sample) | 4.6% | 27.6% |
| Standard Deviation (Population) | 4.6% | 26.0% |
Similar Demographics by Unemployment Among Women with Children Under 6 years
Demographics Similar to Immigrants from Sierra Leone by Unemployment Among Women with Children Under 6 years
In terms of unemployment among women with children under 6 years, the demographic groups most similar to Immigrants from Sierra Leone are Nigerian (8.2%, a difference of 0.010%), Immigrants from Western Africa (8.2%, a difference of 0.090%), German Russian (8.2%, a difference of 0.13%), Guyanese (8.2%, a difference of 0.18%), and Ghanaian (8.2%, a difference of 0.18%).
| Demographics | Rating | Rank | Unemployment Among Women with Children Under 6 years |
| Dutch | 2.5 /100 | #242 | Tragic 8.1% |
| Hawaiians | 1.8 /100 | #243 | Tragic 8.2% |
| French | 1.7 /100 | #244 | Tragic 8.2% |
| Native Hawaiians | 1.7 /100 | #245 | Tragic 8.2% |
| Central Americans | 1.4 /100 | #246 | Tragic 8.2% |
| German Russians | 1.2 /100 | #247 | Tragic 8.2% |
| Immigrants | Western Africa | 1.1 /100 | #248 | Tragic 8.2% |
| Immigrants | Sierra Leone | 1.1 /100 | #249 | Tragic 8.2% |
| Nigerians | 1.1 /100 | #250 | Tragic 8.2% |
| Guyanese | 1.0 /100 | #251 | Tragic 8.2% |
| Ghanaians | 1.0 /100 | #252 | Tragic 8.2% |
| Immigrants | Guyana | 0.8 /100 | #253 | Tragic 8.2% |
| Immigrants | Caribbean | 0.7 /100 | #254 | Tragic 8.3% |
| Immigrants | Portugal | 0.6 /100 | #255 | Tragic 8.3% |
| Celtics | 0.6 /100 | #256 | Tragic 8.3% |
Demographics Similar to Cheyenne by Unemployment Among Women with Children Under 6 years
In terms of unemployment among women with children under 6 years, the demographic groups most similar to Cheyenne are Immigrants from Bangladesh (8.8%, a difference of 0.23%), Jamaican (8.8%, a difference of 0.25%), Nonimmigrants (8.8%, a difference of 0.42%), Immigrants from Central America (8.9%, a difference of 0.46%), and Immigrants from Dominican Republic (8.9%, a difference of 0.60%).
| Demographics | Rating | Rank | Unemployment Among Women with Children Under 6 years |
| U.S. Virgin Islanders | 0.0 /100 | #285 | Tragic 8.7% |
| Seminole | 0.0 /100 | #286 | Tragic 8.7% |
| Menominee | 0.0 /100 | #287 | Tragic 8.7% |
| Bahamians | 0.0 /100 | #288 | Tragic 8.7% |
| Iroquois | 0.0 /100 | #289 | Tragic 8.7% |
| Vietnamese | 0.0 /100 | #290 | Tragic 8.8% |
| Jamaicans | 0.0 /100 | #291 | Tragic 8.8% |
| Cheyenne | 0.0 /100 | #292 | Tragic 8.8% |
| Immigrants | Bangladesh | 0.0 /100 | #293 | Tragic 8.8% |
| Immigrants | Nonimmigrants | 0.0 /100 | #294 | Tragic 8.8% |
| Immigrants | Central America | 0.0 /100 | #295 | Tragic 8.9% |
| Immigrants | Dominican Republic | 0.0 /100 | #296 | Tragic 8.9% |
| Mexicans | 0.0 /100 | #297 | Tragic 8.9% |
| Tlingit-Haida | 0.0 /100 | #298 | Tragic 8.9% |
| Immigrants | Jamaica | 0.0 /100 | #299 | Tragic 8.9% |