Immigrants from Panama vs Cheyenne Unemployment Among Women with Children Under 6 years

COMPARE

Immigrants from Panama
Race
Ancestry
AfghanAfricanAlaska NativeAlaskan AthabascanAlbanianAleutAlsatianAmericanApacheArabArapahoArgentineanArmenianAssyrian/Chaldean/SyriacAustralianAustrianBahamianBangladeshiBarbadianBasqueBelgianBelizeanBermudanBhutaneseBlackfeetBolivianBrazilianBritishBritish West IndianBulgarianBurmeseCajunCambodianCanadianCape VerdeanCarpatho RusynCelticCentral AmericanCentral American IndianCherokeeChickasawChileanChineseChippewaChoctawColombianColvilleComancheCosta RicanCreeCreekCroatianCrowCubanCypriotCzechCzechoslovakianDanishDelawareDominicanDutchDutch West IndianEastern EuropeanEcuadorianEgyptianEnglishEstonianEthiopianEuropeanFijianFilipinoFinnishFrenchFrench American IndianFrench CanadianGermanGerman RussianGhanaianGreekGuamanian/ChamorroGuatemalanGuyaneseHaitianHmongHonduranHopiHoumaHungarianIcelanderIndian (Asian)IndonesianInupiatIranianIraqiIrishIroquoisIsraeliItalianJamaicanJapaneseJordanianKenyanKiowaKoreanLaotianLatvianLebaneseLiberianLithuanianLumbeeLuxembourgerMacedonianMalaysianMalteseMarshalleseMenomineeMexicanMexican American IndianMongolianMoroccanNative HawaiianNavajoNepaleseNew ZealanderNicaraguanNigerianNorthern EuropeanNorwegianOkinawanOsageOttawaPaiutePakistaniPalestinianPanamanianParaguayanPennsylvania GermanPeruvianPimaPolishPortuguesePotawatomiPuebloPuerto RicanPuget Sound SalishRomanianRussianSalvadoranSamoanScandinavianScotch-IrishScottishSeminoleSenegaleseSerbianShoshoneSierra LeoneanSiouxSlavicSlovakSloveneSomaliSouth AfricanSouth AmericanSouth American IndianSoviet UnionSpaniardSpanishSpanish AmericanSpanish American IndianSri LankanSubsaharan AfricanSudaneseSwedishSwissSyrianTaiwaneseThaiTlingit-HaidaTohono O'OdhamTonganTrinidadian and TobagonianTsimshianTurkishU.S. Virgin IslanderUgandanUkrainianUruguayanUteVenezuelanVietnameseWelshWest IndianYakamaYaquiYugoslavianYumanYup'ikZimbabwean
Immigration
NonimmigrantsImmigrantsAfghanistanAfricaAlbaniaArgentinaArmeniaAsiaAustraliaAustriaBahamasBangladeshBarbadosBelarusBelgiumBelizeBoliviaBosnia and HerzegovinaBrazilBulgariaBurma/MyanmarCabo VerdeCambodiaCameroonCanadaCaribbeanCentral AmericaChileChinaColombiaCongoCosta RicaCroatiaCubaCzechoslovakiaDenmarkDominicaDominican RepublicEastern AfricaEastern AsiaEastern EuropeEcuadorEgyptEl SalvadorEnglandEritreaEthiopiaEuropeFijiFranceGermanyGhanaGreeceGrenadaGuatemalaGuyanaHaitiHondurasHong KongHungaryIndiaIndonesiaIranIraqIrelandIsraelItalyJamaicaJapanJordanKazakhstanKenyaKoreaKuwaitLaosLatin AmericaLatviaLebanonLiberiaLithuaniaMalaysiaMexicoMicronesiaMiddle AfricaMoldovaMoroccoNepalNetherlandsNicaraguaNigeriaNorth AmericaNorth MacedoniaNorthern AfricaNorthern EuropeNorwayOceaniaPakistanPanamaPeruPhilippinesPolandPortugalRomaniaRussiaSaudi ArabiaScotlandSenegalSerbiaSierra LeoneSingaporeSomaliaSouth AfricaSouth AmericaSouth Central AsiaSouth Eastern AsiaSouthern EuropeSpainSri LankaSt. Vincent and the GrenadinesSudanSwedenSwitzerlandSyriaTaiwanThailandTrinidad and TobagoTurkeyUgandaUkraineUruguayUzbekistanVenezuelaVietnamWest IndiesWestern AfricaWestern AsiaWestern EuropeYemenZaireZimbabweAzores
Cheyenne
Race
Ancestry
AfghanAfricanAlaska NativeAlaskan AthabascanAlbanianAleutAlsatianAmericanApacheArabArapahoArgentineanArmenianAssyrian/Chaldean/SyriacAustralianAustrianBahamianBangladeshiBarbadianBasqueBelgianBelizeanBermudanBhutaneseBlackfeetBolivianBrazilianBritishBritish West IndianBulgarianBurmeseCajunCambodianCanadianCape VerdeanCarpatho RusynCelticCentral AmericanCentral American IndianCherokeeCheyenneChickasawChileanChineseChippewaChoctawColombianColvilleComancheCosta RicanCreeCreekCroatianCrowCubanCypriotCzechCzechoslovakianDanishDelawareDominicanDutchDutch West IndianEastern EuropeanEcuadorianEgyptianEnglishEstonianEthiopianEuropeanFijianFilipinoFinnishFrenchFrench American IndianFrench CanadianGermanGerman RussianGhanaianGreekGuamanian/ChamorroGuatemalanGuyaneseHaitianHmongHonduranHopiHoumaHungarianIcelanderIndian (Asian)IndonesianInupiatIranianIraqiIrishIroquoisIsraeliItalianJamaicanJapaneseJordanianKenyanKiowaKoreanLaotianLatvianLebaneseLiberianLithuanianLumbeeLuxembourgerMacedonianMalaysianMalteseMarshalleseMenomineeMexicanMexican American IndianMongolianMoroccanNative HawaiianNavajoNepaleseNew ZealanderNicaraguanNigerianNorthern EuropeanNorwegianOkinawanOsageOttawaPaiutePakistaniPalestinianPanamanianParaguayanPennsylvania GermanPeruvianPimaPolishPortuguesePotawatomiPuebloPuerto RicanPuget Sound SalishRomanianRussianSalvadoranSamoanScandinavianScotch-IrishScottishSeminoleSenegaleseSerbianShoshoneSierra LeoneanSiouxSlavicSlovakSloveneSomaliSouth AfricanSouth AmericanSouth American IndianSoviet UnionSpaniardSpanishSpanish AmericanSpanish American IndianSri LankanSubsaharan AfricanSudaneseSwedishSwissSyrianTaiwaneseThaiTlingit-HaidaTohono O'OdhamTonganTrinidadian and TobagonianTsimshianTurkishU.S. Virgin IslanderUgandanUkrainianUruguayanUteVenezuelanVietnameseWelshWest IndianYakamaYaquiYugoslavianYumanYup'ikZimbabwean
Immigration
NonimmigrantsImmigrantsAfghanistanAfricaAlbaniaArgentinaArmeniaAsiaAustraliaAustriaBahamasBangladeshBarbadosBelarusBelgiumBelizeBoliviaBosnia and HerzegovinaBrazilBulgariaBurma/MyanmarCabo VerdeCambodiaCameroonCanadaCaribbeanCentral AmericaChileChinaColombiaCongoCosta RicaCroatiaCubaCzechoslovakiaDenmarkDominicaDominican RepublicEastern AfricaEastern AsiaEastern EuropeEcuadorEgyptEl SalvadorEnglandEritreaEthiopiaEuropeFijiFranceGermanyGhanaGreeceGrenadaGuatemalaGuyanaHaitiHondurasHong KongHungaryIndiaIndonesiaIranIraqIrelandIsraelItalyJamaicaJapanJordanKazakhstanKenyaKoreaKuwaitLaosLatin AmericaLatviaLebanonLiberiaLithuaniaMalaysiaMexicoMicronesiaMiddle AfricaMoldovaMoroccoNepalNetherlandsNicaraguaNigeriaNorth AmericaNorth MacedoniaNorthern AfricaNorthern EuropeNorwayOceaniaPakistanPeruPhilippinesPolandPortugalRomaniaRussiaSaudi ArabiaScotlandSenegalSerbiaSierra LeoneSingaporeSomaliaSouth AfricaSouth AmericaSouth Central AsiaSouth Eastern AsiaSouthern EuropeSpainSri LankaSt. Vincent and the GrenadinesSudanSwedenSwitzerlandSyriaTaiwanThailandTrinidad and TobagoTurkeyUgandaUkraineUruguayUzbekistanVenezuelaVietnamWest IndiesWestern AfricaWestern AsiaWestern EuropeYemenZaireZimbabweAzores
Unemployment Among Women with Children Under 6 years
Income
Poverty
Unemployment
Labor Participation
Family Structure
Vehicle Availability
Education Level
Disability

Unemployment Among Women with Children Under 6 years Comparison

Immigrants from Panama

Cheyenne

Fair
Tragic
7.7%
UNEMPLOYMENT AMONG WOMEN WITH CHILDREN UNDER 6 YEARS
35.7/ 100
METRIC RATING
189th/ 347
METRIC RANK
8.8%
UNEMPLOYMENT AMONG WOMEN WITH CHILDREN UNDER 6 YEARS
0.0/ 100
METRIC RATING
292nd/ 347
METRIC RANK

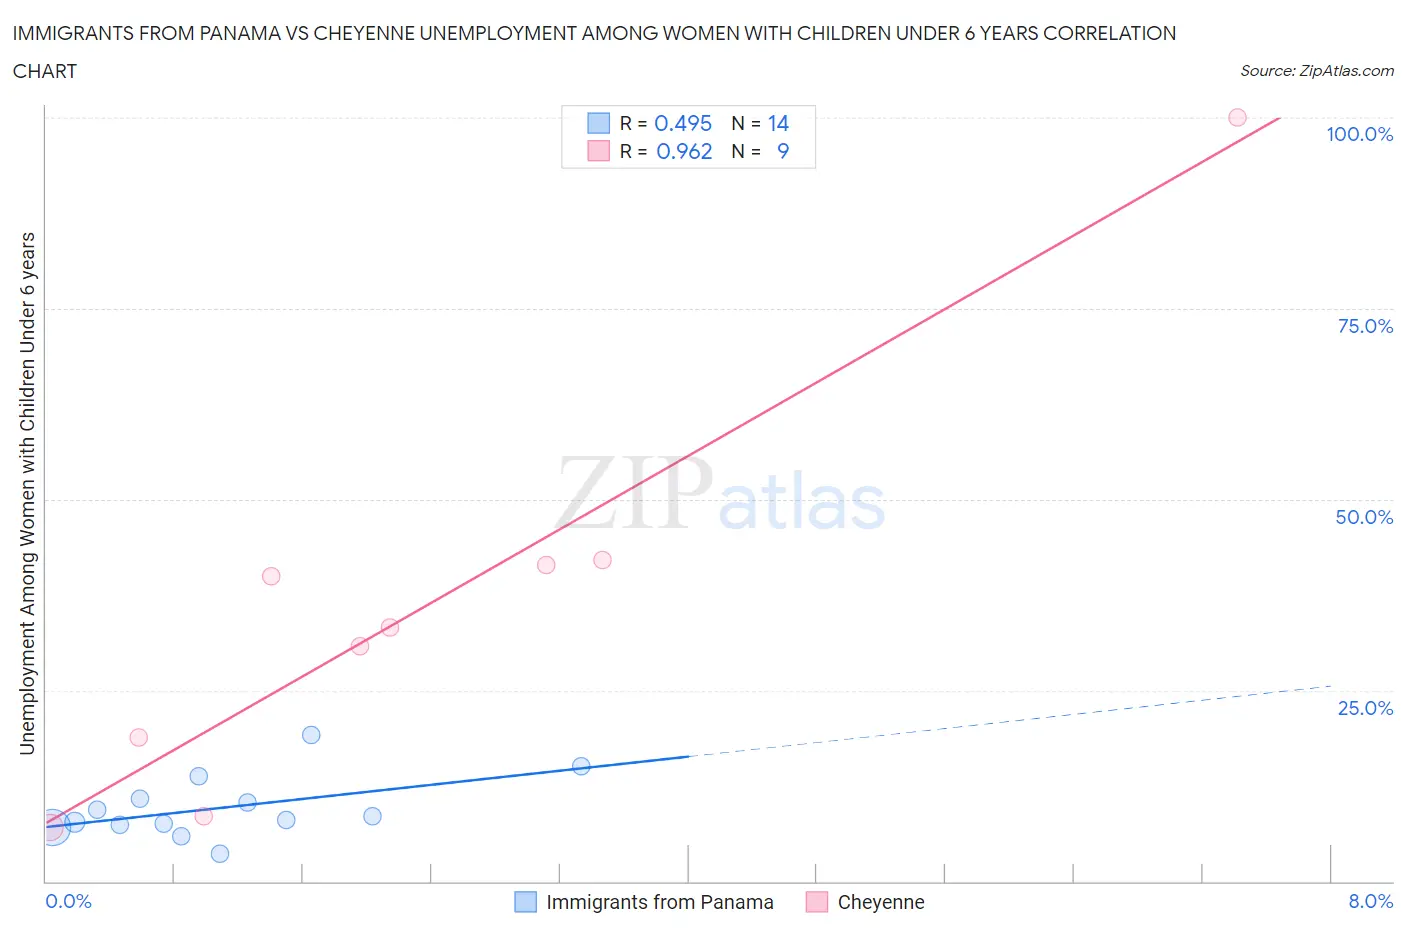
Immigrants from Panama vs Cheyenne Unemployment Among Women with Children Under 6 years Correlation Chart

The statistical analysis conducted on geographies consisting of 188,916,649 people shows a moderate positive correlation between the proportion of Immigrants from Panama and unemployment rate among women with children under the age of 6 in the United States with a correlation coefficient (R) of 0.495 and weighted average of 7.7%. Similarly, the statistical analysis conducted on geographies consisting of 73,227,790 people shows a perfect positive correlation between the proportion of Cheyenne and unemployment rate among women with children under the age of 6 in the United States with a correlation coefficient (R) of 0.962 and weighted average of 8.8%, a difference of 14.2%.
Immigrants from Panama vs Cheyenne Unemployment Among Women with Children Under 6 years

Unemployment Among Women with Children Under 6 years Correlation Summary

MeasurementImmigrants from PanamaCheyenne
Minimum3.5%7.0%
Maximum19.1%100.0%
Range15.6%93.0%
Mean9.6%35.8%
Median8.2%33.3%
Interquartile 25% (IQ1)7.3%13.7%
Interquartile 75% (IQ3)10.8%41.7%
Interquartile Range (IQR)3.4%28.0%
Standard Deviation (Sample)4.0%27.6%
Standard Deviation (Population)3.9%26.0%

Similar Demographics by Unemployment Among Women with Children Under 6 years

Demographics Similar to Immigrants from Panama by Unemployment Among Women with Children Under 6 years

In terms of unemployment among women with children under 6 years, the demographic groups most similar to Immigrants from Panama are Immigrants from North Macedonia (7.7%, a difference of 0.090%), Immigrants from Thailand (7.7%, a difference of 0.20%), Czechoslovakian (7.7%, a difference of 0.20%), Immigrants from Austria (7.7%, a difference of 0.24%), and Immigrants from Africa (7.7%, a difference of 0.24%).
DemographicsRating | RankUnemployment Among Women with Children Under 6 years
Nepalese
43.5
/100
|
#182
Average
7.7%
Sierra Leoneans
42.9
/100
|
#183
Average
7.7%
Indonesians
40.5
/100
|
#184
Average
7.7%
Spanish Americans
39.7
/100
|
#185
Fair
7.7%
Yugoslavians
39.4
/100
|
#186
Fair
7.7%
Immigrants | Thailand
38.5
/100
|
#187
Fair
7.7%
Czechoslovakians
38.4
/100
|
#188
Fair
7.7%
Immigrants | Panama
35.7
/100
|
#189
Fair
7.7%
Immigrants | North Macedonia
34.4
/100
|
#190
Fair
7.7%
Immigrants | Austria
32.4
/100
|
#191
Fair
7.7%
Immigrants | Africa
32.4
/100
|
#192
Fair
7.7%
Slavs
32.4
/100
|
#193
Fair
7.7%
Syrians
31.9
/100
|
#194
Fair
7.7%
Malaysians
31.1
/100
|
#195
Fair
7.7%
Immigrants | St. Vincent and the Grenadines
31.1
/100
|
#196
Fair
7.7%

Demographics Similar to Cheyenne by Unemployment Among Women with Children Under 6 years

In terms of unemployment among women with children under 6 years, the demographic groups most similar to Cheyenne are Immigrants from Bangladesh (8.8%, a difference of 0.23%), Jamaican (8.8%, a difference of 0.25%), Nonimmigrants (8.8%, a difference of 0.42%), Immigrants from Central America (8.9%, a difference of 0.46%), and Immigrants from Dominican Republic (8.9%, a difference of 0.60%).
DemographicsRating | RankUnemployment Among Women with Children Under 6 years
U.S. Virgin Islanders
0.0
/100
|
#285
Tragic
8.7%
Seminole
0.0
/100
|
#286
Tragic
8.7%
Menominee
0.0
/100
|
#287
Tragic
8.7%
Bahamians
0.0
/100
|
#288
Tragic
8.7%
Iroquois
0.0
/100
|
#289
Tragic
8.7%
Vietnamese
0.0
/100
|
#290
Tragic
8.8%
Jamaicans
0.0
/100
|
#291
Tragic
8.8%
Cheyenne
0.0
/100
|
#292
Tragic
8.8%
Immigrants | Bangladesh
0.0
/100
|
#293
Tragic
8.8%
Immigrants | Nonimmigrants
0.0
/100
|
#294
Tragic
8.8%
Immigrants | Central America
0.0
/100
|
#295
Tragic
8.9%
Immigrants | Dominican Republic
0.0
/100
|
#296
Tragic
8.9%
Mexicans
0.0
/100
|
#297
Tragic
8.9%
Tlingit-Haida
0.0
/100
|
#298
Tragic
8.9%
Immigrants | Jamaica
0.0
/100
|
#299
Tragic
8.9%