Black/African American vs Immigrants from Poland Male Unemployment
COMPARE
Black/African American
Immigrants from Poland
Male Unemployment
Male Unemployment Comparison
Blacks/African Americans
Immigrants from Poland
6.9%
MALE UNEMPLOYMENT
0.0/ 100
METRIC RATING
310th/ 347
METRIC RANK
5.3%
MALE UNEMPLOYMENT
46.0/ 100
METRIC RATING
176th/ 347
METRIC RANK
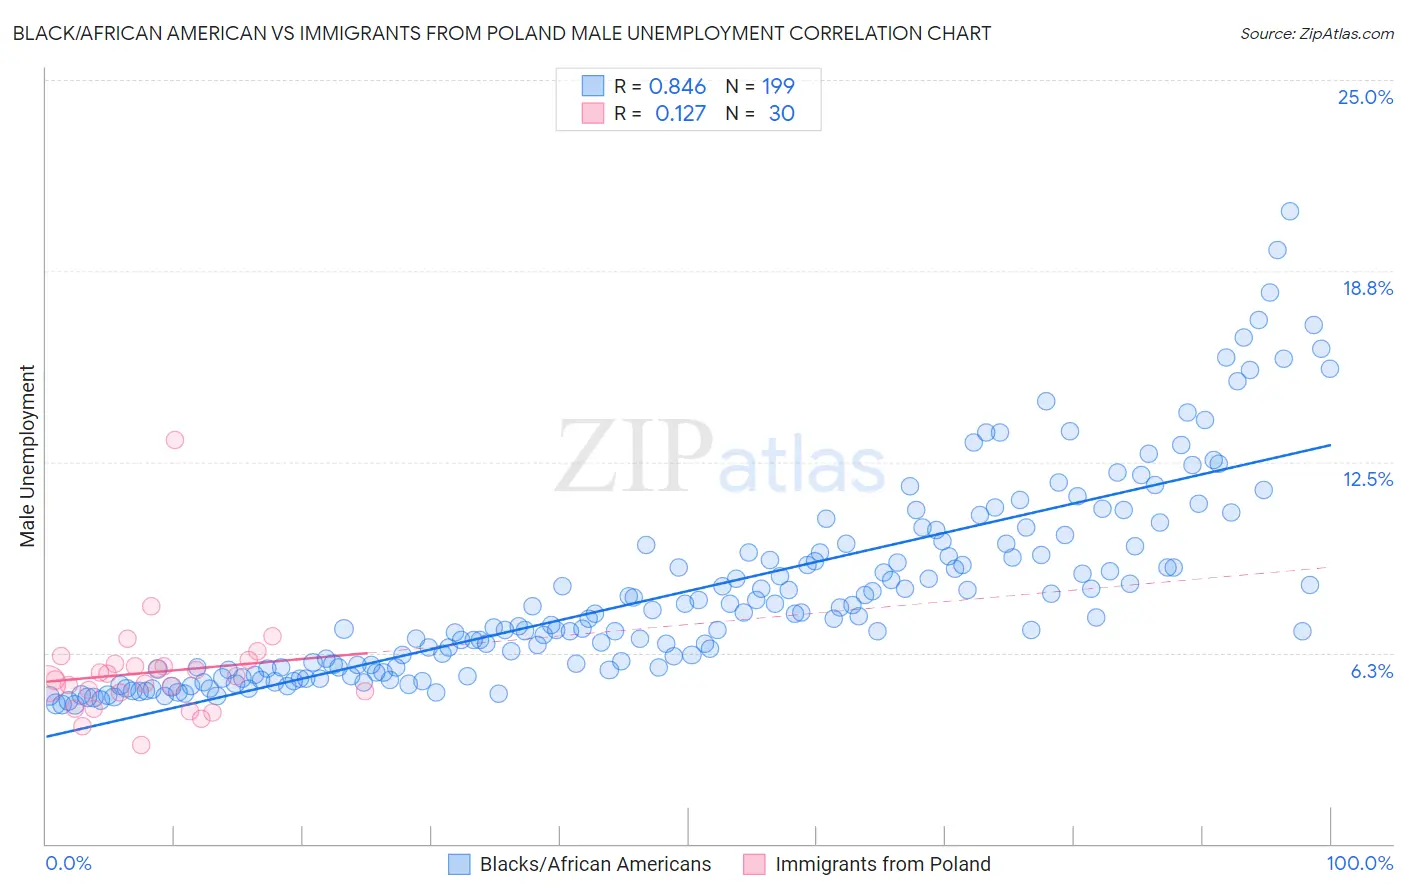
Black/African American vs Immigrants from Poland Male Unemployment Correlation Chart
The statistical analysis conducted on geographies consisting of 557,031,145 people shows a very strong positive correlation between the proportion of Blacks/African Americans and unemployment rate among males in the United States with a correlation coefficient (R) of 0.846 and weighted average of 6.9%. Similarly, the statistical analysis conducted on geographies consisting of 304,027,535 people shows a poor positive correlation between the proportion of Immigrants from Poland and unemployment rate among males in the United States with a correlation coefficient (R) of 0.127 and weighted average of 5.3%, a difference of 30.0%.
Male Unemployment Correlation Summary
| Measurement | Black/African American | Immigrants from Poland |
| Minimum | 4.5% | 3.3% |
| Maximum | 20.7% | 13.2% |
| Range | 16.2% | 9.9% |
| Mean | 8.3% | 5.6% |
| Median | 7.4% | 5.4% |
| Interquartile 25% (IQ1) | 5.7% | 4.9% |
| Interquartile 75% (IQ3) | 9.7% | 5.9% |
| Interquartile Range (IQR) | 4.0% | 0.93% |
| Standard Deviation (Sample) | 3.3% | 1.7% |
| Standard Deviation (Population) | 3.2% | 1.7% |
Similar Demographics by Male Unemployment
Demographics Similar to Blacks/African Americans by Male Unemployment
In terms of male unemployment, the demographic groups most similar to Blacks/African Americans are Immigrants from Armenia (6.9%, a difference of 0.31%), Lumbee (6.9%, a difference of 0.52%), Barbadian (6.9%, a difference of 0.64%), Aleut (6.8%, a difference of 1.1%), and Immigrants from Dominica (7.0%, a difference of 1.6%).
| Demographics | Rating | Rank | Male Unemployment |
| Immigrants | West Indies | 0.0 /100 | #303 | Tragic 6.7% |
| West Indians | 0.0 /100 | #304 | Tragic 6.7% |
| Trinidadians and Tobagonians | 0.0 /100 | #305 | Tragic 6.7% |
| Immigrants | Trinidad and Tobago | 0.0 /100 | #306 | Tragic 6.7% |
| Immigrants | Jamaica | 0.0 /100 | #307 | Tragic 6.7% |
| Aleuts | 0.0 /100 | #308 | Tragic 6.8% |
| Barbadians | 0.0 /100 | #309 | Tragic 6.9% |
| Blacks/African Americans | 0.0 /100 | #310 | Tragic 6.9% |
| Immigrants | Armenia | 0.0 /100 | #311 | Tragic 6.9% |
| Lumbee | 0.0 /100 | #312 | Tragic 6.9% |
| Immigrants | Dominica | 0.0 /100 | #313 | Tragic 7.0% |
| Immigrants | Barbados | 0.0 /100 | #314 | Tragic 7.1% |
| Houma | 0.0 /100 | #315 | Tragic 7.1% |
| Immigrants | Guyana | 0.0 /100 | #316 | Tragic 7.1% |
| Guyanese | 0.0 /100 | #317 | Tragic 7.1% |
Demographics Similar to Immigrants from Poland by Male Unemployment
In terms of male unemployment, the demographic groups most similar to Immigrants from Poland are Immigrants from Peru (5.3%, a difference of 0.080%), Immigrants from Iraq (5.3%, a difference of 0.12%), Osage (5.3%, a difference of 0.21%), Immigrants from Iran (5.3%, a difference of 0.23%), and Immigrants from Kazakhstan (5.3%, a difference of 0.28%).
| Demographics | Rating | Rank | Male Unemployment |
| Immigrants | Congo | 57.4 /100 | #169 | Average 5.3% |
| Immigrants | Eastern Europe | 54.1 /100 | #170 | Average 5.3% |
| Peruvians | 51.9 /100 | #171 | Average 5.3% |
| Immigrants | Kazakhstan | 50.8 /100 | #172 | Average 5.3% |
| Immigrants | Russia | 50.7 /100 | #173 | Average 5.3% |
| Immigrants | Iran | 50.0 /100 | #174 | Average 5.3% |
| Immigrants | Iraq | 48.1 /100 | #175 | Average 5.3% |
| Immigrants | Poland | 46.0 /100 | #176 | Average 5.3% |
| Immigrants | Peru | 44.6 /100 | #177 | Average 5.3% |
| Osage | 42.5 /100 | #178 | Average 5.3% |
| Immigrants | Oceania | 40.8 /100 | #179 | Average 5.3% |
| Malaysians | 39.6 /100 | #180 | Fair 5.3% |
| Immigrants | Afghanistan | 37.9 /100 | #181 | Fair 5.3% |
| Potawatomi | 37.8 /100 | #182 | Fair 5.3% |
| Taiwanese | 37.6 /100 | #183 | Fair 5.3% |