Aleut vs Immigrants from Bolivia Unemployment Among Youth under 25 years

COMPARE

Aleut
Race
Ancestry
AfghanAfricanAlaska NativeAlaskan AthabascanAlbanianAleutAlsatianAmericanApacheArabArapahoArgentineanArmenianAssyrian/Chaldean/SyriacAustralianAustrianBahamianBangladeshiBarbadianBasqueBelgianBelizeanBermudanBhutaneseBlackfeetBolivianBrazilianBritishBritish West IndianBulgarianBurmeseCajunCambodianCanadianCape VerdeanCarpatho RusynCelticCentral AmericanCentral American IndianCherokeeCheyenneChickasawChileanChineseChippewaChoctawColombianColvilleComancheCosta RicanCreeCreekCroatianCrowCubanCypriotCzechCzechoslovakianDanishDelawareDominicanDutchDutch West IndianEastern EuropeanEcuadorianEgyptianEnglishEstonianEthiopianEuropeanFijianFilipinoFinnishFrenchFrench American IndianFrench CanadianGermanGerman RussianGhanaianGreekGuamanian/ChamorroGuatemalanGuyaneseHaitianHmongHonduranHopiHoumaHungarianIcelanderIndian (Asian)IndonesianInupiatIranianIraqiIrishIroquoisIsraeliItalianJamaicanJapaneseJordanianKenyanKiowaKoreanLaotianLatvianLebaneseLiberianLithuanianLumbeeLuxembourgerMacedonianMalaysianMalteseMarshalleseMenomineeMexicanMexican American IndianMongolianMoroccanNative HawaiianNavajoNepaleseNew ZealanderNicaraguanNigerianNorthern EuropeanNorwegianOkinawanOsageOttawaPaiutePakistaniPalestinianPanamanianParaguayanPennsylvania GermanPeruvianPimaPolishPortuguesePotawatomiPuebloPuerto RicanPuget Sound SalishRomanianRussianSalvadoranSamoanScandinavianScotch-IrishScottishSeminoleSenegaleseSerbianShoshoneSierra LeoneanSiouxSlavicSlovakSloveneSomaliSouth AfricanSouth AmericanSouth American IndianSoviet UnionSpaniardSpanishSpanish AmericanSpanish American IndianSri LankanSubsaharan AfricanSudaneseSwedishSwissSyrianTaiwaneseThaiTlingit-HaidaTohono O'OdhamTonganTrinidadian and TobagonianTsimshianTurkishU.S. Virgin IslanderUgandanUkrainianUruguayanUteVenezuelanVietnameseWelshWest IndianYakamaYaquiYugoslavianYumanYup'ikZimbabwean
Immigration
NonimmigrantsImmigrantsAfghanistanAfricaAlbaniaArgentinaArmeniaAsiaAustraliaAustriaBahamasBangladeshBarbadosBelarusBelgiumBelizeBosnia and HerzegovinaBrazilBulgariaBurma/MyanmarCabo VerdeCambodiaCameroonCanadaCaribbeanCentral AmericaChileChinaColombiaCongoCosta RicaCroatiaCubaCzechoslovakiaDenmarkDominicaDominican RepublicEastern AfricaEastern AsiaEastern EuropeEcuadorEgyptEl SalvadorEnglandEritreaEthiopiaEuropeFijiFranceGermanyGhanaGreeceGrenadaGuatemalaGuyanaHaitiHondurasHong KongHungaryIndiaIndonesiaIranIraqIrelandIsraelItalyJamaicaJapanJordanKazakhstanKenyaKoreaKuwaitLaosLatin AmericaLatviaLebanonLiberiaLithuaniaMalaysiaMexicoMicronesiaMiddle AfricaMoldovaMoroccoNepalNetherlandsNicaraguaNigeriaNorth AmericaNorth MacedoniaNorthern AfricaNorthern EuropeNorwayOceaniaPakistanPanamaPeruPhilippinesPolandPortugalRomaniaRussiaSaudi ArabiaScotlandSenegalSerbiaSierra LeoneSingaporeSomaliaSouth AfricaSouth AmericaSouth Central AsiaSouth Eastern AsiaSouthern EuropeSpainSri LankaSt. Vincent and the GrenadinesSudanSwedenSwitzerlandSyriaTaiwanThailandTrinidad and TobagoTurkeyUgandaUkraineUruguayUzbekistanVenezuelaVietnamWest IndiesWestern AfricaWestern AsiaWestern EuropeYemenZaireZimbabweAzores
Immigrants from Bolivia
Race
Ancestry
AfghanAfricanAlaska NativeAlaskan AthabascanAlbanianAlsatianAmericanApacheArabArapahoArgentineanArmenianAssyrian/Chaldean/SyriacAustralianAustrianBahamianBangladeshiBarbadianBasqueBelgianBelizeanBermudanBhutaneseBlackfeetBolivianBrazilianBritishBritish West IndianBulgarianBurmeseCajunCambodianCanadianCape VerdeanCarpatho RusynCelticCentral AmericanCentral American IndianCherokeeCheyenneChickasawChileanChineseChippewaChoctawColombianColvilleComancheCosta RicanCreeCreekCroatianCrowCubanCypriotCzechCzechoslovakianDanishDelawareDominicanDutchDutch West IndianEastern EuropeanEcuadorianEgyptianEnglishEstonianEthiopianEuropeanFijianFilipinoFinnishFrenchFrench American IndianFrench CanadianGermanGerman RussianGhanaianGreekGuamanian/ChamorroGuatemalanGuyaneseHaitianHmongHonduranHopiHoumaHungarianIcelanderIndian (Asian)IndonesianInupiatIranianIraqiIrishIroquoisIsraeliItalianJamaicanJapaneseJordanianKenyanKiowaKoreanLaotianLatvianLebaneseLiberianLithuanianLumbeeLuxembourgerMacedonianMalaysianMalteseMarshalleseMenomineeMexicanMexican American IndianMongolianMoroccanNative HawaiianNavajoNepaleseNew ZealanderNicaraguanNigerianNorthern EuropeanNorwegianOkinawanOsageOttawaPaiutePakistaniPalestinianPanamanianParaguayanPennsylvania GermanPeruvianPimaPolishPortuguesePotawatomiPuebloPuerto RicanPuget Sound SalishRomanianRussianSalvadoranSamoanScandinavianScotch-IrishScottishSeminoleSenegaleseSerbianShoshoneSierra LeoneanSiouxSlavicSlovakSloveneSomaliSouth AfricanSouth AmericanSouth American IndianSoviet UnionSpaniardSpanishSpanish AmericanSpanish American IndianSri LankanSubsaharan AfricanSudaneseSwedishSwissSyrianTaiwaneseThaiTlingit-HaidaTohono O'OdhamTonganTrinidadian and TobagonianTsimshianTurkishU.S. Virgin IslanderUgandanUkrainianUruguayanUteVenezuelanVietnameseWelshWest IndianYakamaYaquiYugoslavianYumanYup'ikZimbabwean
Immigration
NonimmigrantsImmigrantsAfghanistanAfricaAlbaniaArgentinaArmeniaAsiaAustraliaAustriaBahamasBangladeshBarbadosBelarusBelgiumBelizeBoliviaBosnia and HerzegovinaBrazilBulgariaBurma/MyanmarCabo VerdeCambodiaCameroonCanadaCaribbeanCentral AmericaChileChinaColombiaCongoCosta RicaCroatiaCubaCzechoslovakiaDenmarkDominicaDominican RepublicEastern AfricaEastern AsiaEastern EuropeEcuadorEgyptEl SalvadorEnglandEritreaEthiopiaEuropeFijiFranceGermanyGhanaGreeceGrenadaGuatemalaGuyanaHaitiHondurasHong KongHungaryIndiaIndonesiaIranIraqIrelandIsraelItalyJamaicaJapanJordanKazakhstanKenyaKoreaKuwaitLaosLatin AmericaLatviaLebanonLiberiaLithuaniaMalaysiaMexicoMicronesiaMiddle AfricaMoldovaMoroccoNepalNetherlandsNicaraguaNigeriaNorth AmericaNorth MacedoniaNorthern AfricaNorthern EuropeNorwayOceaniaPakistanPanamaPeruPhilippinesPolandPortugalRomaniaRussiaSaudi ArabiaScotlandSenegalSerbiaSierra LeoneSingaporeSomaliaSouth AfricaSouth AmericaSouth Central AsiaSouth Eastern AsiaSouthern EuropeSpainSri LankaSt. Vincent and the GrenadinesSudanSwedenSwitzerlandSyriaTaiwanThailandTrinidad and TobagoTurkeyUgandaUkraineUruguayUzbekistanVenezuelaVietnamWest IndiesWestern AfricaWestern AsiaWestern EuropeYemenZaireZimbabweAzores
Unemployment Among Youth under 25 years
Income
Poverty
Unemployment
Labor Participation
Family Structure
Vehicle Availability
Education Level
Disability

Unemployment Among Youth under 25 years Comparison

Aleuts

Immigrants from Bolivia

Tragic
Exceptional
14.1%
UNEMPLOYMENT AMONG YOUTH UNDER 25 YEARS
0.0/ 100
METRIC RATING
309th/ 347
METRIC RANK
11.2%
UNEMPLOYMENT AMONG YOUTH UNDER 25 YEARS
95.5/ 100
METRIC RATING
90th/ 347
METRIC RANK

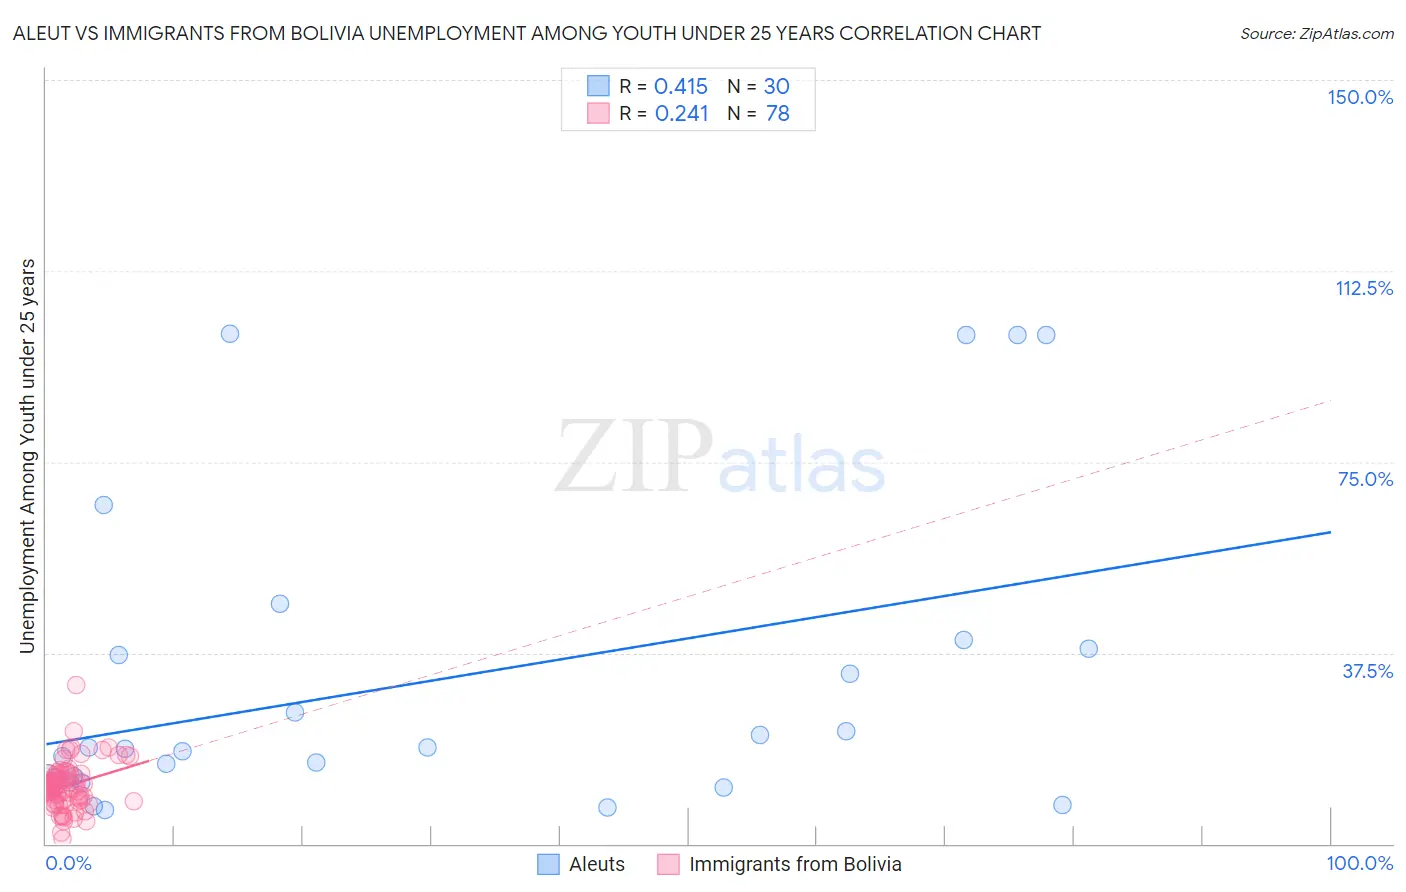
Aleut vs Immigrants from Bolivia Unemployment Among Youth under 25 years Correlation Chart

The statistical analysis conducted on geographies consisting of 61,559,478 people shows a moderate positive correlation between the proportion of Aleuts and unemployment rate among youth under the age of 25 in the United States with a correlation coefficient (R) of 0.415 and weighted average of 14.1%. Similarly, the statistical analysis conducted on geographies consisting of 158,119,708 people shows a weak positive correlation between the proportion of Immigrants from Bolivia and unemployment rate among youth under the age of 25 in the United States with a correlation coefficient (R) of 0.241 and weighted average of 11.2%, a difference of 25.7%.
Aleut vs Immigrants from Bolivia Unemployment Among Youth under 25 years

Unemployment Among Youth under 25 years Correlation Summary

MeasurementAleutImmigrants from Bolivia
Minimum6.6%1.0%
Maximum100.1%31.3%
Range93.5%30.3%
Mean31.9%11.4%
Median18.8%11.5%
Interquartile 25% (IQ1)12.4%8.4%
Interquartile 75% (IQ3)38.4%13.8%
Interquartile Range (IQR)26.0%5.5%
Standard Deviation (Sample)30.3%4.7%
Standard Deviation (Population)29.8%4.7%

Similar Demographics by Unemployment Among Youth under 25 years

Demographics Similar to Aleuts by Unemployment Among Youth under 25 years

In terms of unemployment among youth under 25 years, the demographic groups most similar to Aleuts are Immigrants from West Indies (14.2%, a difference of 0.54%), Immigrants from Bangladesh (14.2%, a difference of 0.57%), Immigrants from Belize (14.0%, a difference of 0.86%), Vietnamese (14.3%, a difference of 0.89%), and Immigrants from Haiti (14.0%, a difference of 1.3%).
DemographicsRating | RankUnemployment Among Youth under 25 years
Immigrants | Sierra Leone
0.0
/100
|
#302
Tragic
13.8%
Belizeans
0.0
/100
|
#303
Tragic
13.8%
Houma
0.0
/100
|
#304
Tragic
13.8%
Haitians
0.0
/100
|
#305
Tragic
13.9%
Pueblo
0.0
/100
|
#306
Tragic
13.9%
Immigrants | Haiti
0.0
/100
|
#307
Tragic
14.0%
Immigrants | Belize
0.0
/100
|
#308
Tragic
14.0%
Aleuts
0.0
/100
|
#309
Tragic
14.1%
Immigrants | West Indies
0.0
/100
|
#310
Tragic
14.2%
Immigrants | Bangladesh
0.0
/100
|
#311
Tragic
14.2%
Vietnamese
0.0
/100
|
#312
Tragic
14.3%
Immigrants | Armenia
0.0
/100
|
#313
Tragic
14.4%
Jamaicans
0.0
/100
|
#314
Tragic
14.4%
Sioux
0.0
/100
|
#315
Tragic
14.4%
Natives/Alaskans
0.0
/100
|
#316
Tragic
14.5%

Demographics Similar to Immigrants from Bolivia by Unemployment Among Youth under 25 years

In terms of unemployment among youth under 25 years, the demographic groups most similar to Immigrants from Bolivia are Austrian (11.2%, a difference of 0.010%), Immigrants from Japan (11.2%, a difference of 0.010%), Kenyan (11.2%, a difference of 0.070%), Immigrants from South Africa (11.2%, a difference of 0.080%), and Immigrants from Taiwan (11.2%, a difference of 0.080%).
DemographicsRating | RankUnemployment Among Youth under 25 years
Bolivians
96.1
/100
|
#83
Exceptional
11.2%
French Canadians
95.9
/100
|
#84
Exceptional
11.2%
Immigrants | South Central Asia
95.9
/100
|
#85
Exceptional
11.2%
Immigrants | South Africa
95.8
/100
|
#86
Exceptional
11.2%
Kenyans
95.7
/100
|
#87
Exceptional
11.2%
Austrians
95.5
/100
|
#88
Exceptional
11.2%
Immigrants | Japan
95.5
/100
|
#89
Exceptional
11.2%
Immigrants | Bolivia
95.5
/100
|
#90
Exceptional
11.2%
Immigrants | Taiwan
95.1
/100
|
#91
Exceptional
11.2%
Immigrants | Latvia
95.1
/100
|
#92
Exceptional
11.2%
Immigrants | North America
95.1
/100
|
#93
Exceptional
11.2%
Lithuanians
94.8
/100
|
#94
Exceptional
11.3%
Carpatho Rusyns
94.4
/100
|
#95
Exceptional
11.3%
Immigrants | Serbia
94.4
/100
|
#96
Exceptional
11.3%
Nicaraguans
94.3
/100
|
#97
Exceptional
11.3%