Albanian vs Colville In Labor Force | Age 30-34
COMPARE
Albanian
Colville
In Labor Force | Age 30-34
In Labor Force | Age 30-34 Comparison
Albanians
Colville
85.7%
IN LABOR FORCE | AGE 30-34
99.9/ 100
METRIC RATING
36th/ 347
METRIC RANK
80.7%
IN LABOR FORCE | AGE 30-34
0.0/ 100
METRIC RATING
327th/ 347
METRIC RANK
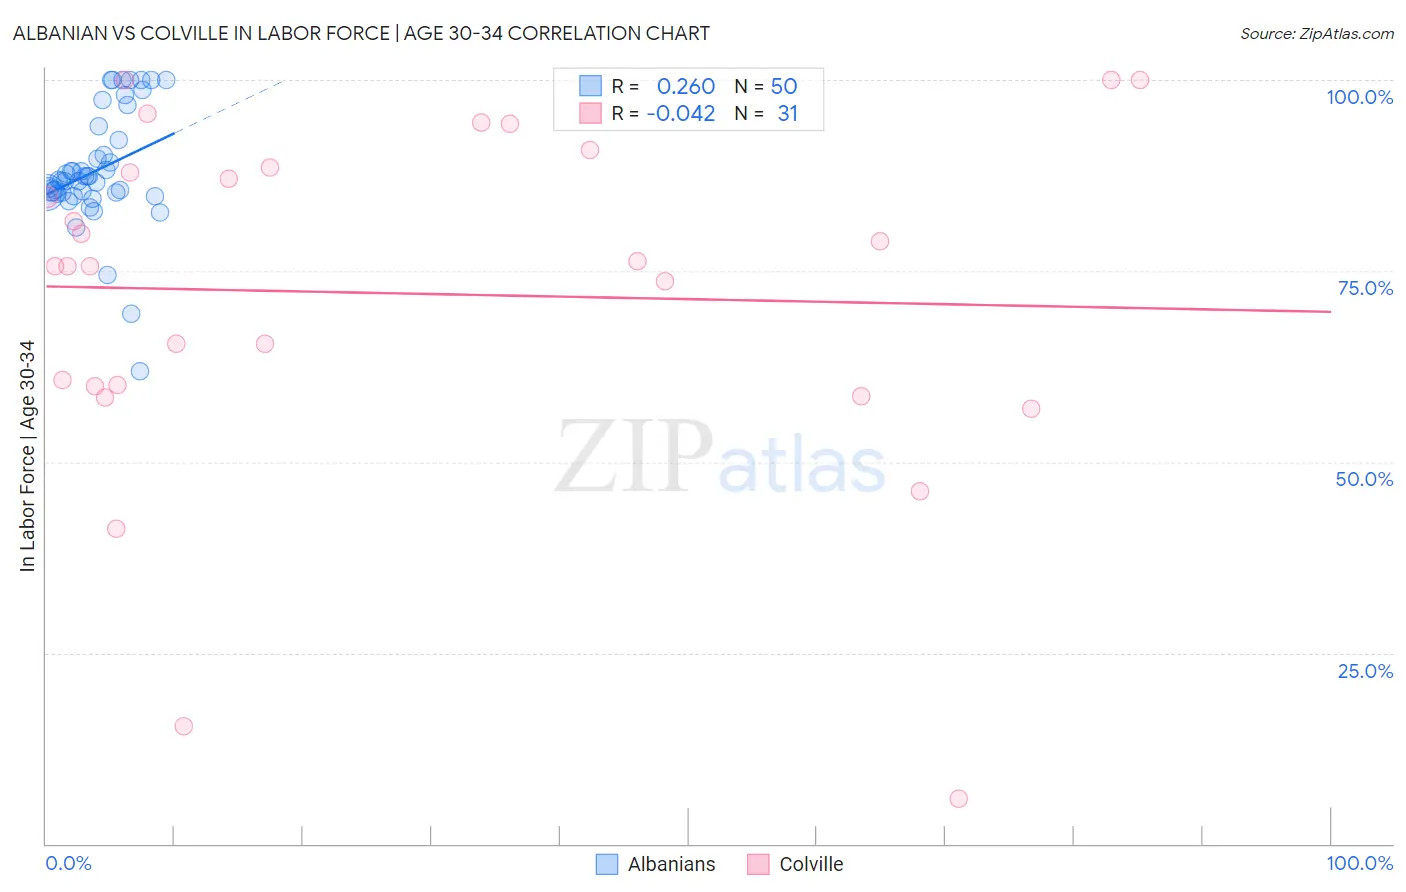
Albanian vs Colville In Labor Force | Age 30-34 Correlation Chart
The statistical analysis conducted on geographies consisting of 193,201,711 people shows a weak positive correlation between the proportion of Albanians and labor force participation rate among population between the ages 30 and 34 in the United States with a correlation coefficient (R) of 0.260 and weighted average of 85.7%. Similarly, the statistical analysis conducted on geographies consisting of 34,677,066 people shows no correlation between the proportion of Colville and labor force participation rate among population between the ages 30 and 34 in the United States with a correlation coefficient (R) of -0.042 and weighted average of 80.7%, a difference of 6.3%.
In Labor Force | Age 30-34 Correlation Summary
| Measurement | Albanian | Colville |
| Minimum | 61.9% | 5.9% |
| Maximum | 100.0% | 100.0% |
| Range | 38.1% | 94.1% |
| Mean | 88.2% | 72.1% |
| Median | 86.8% | 75.7% |
| Interquartile 25% (IQ1) | 85.3% | 59.8% |
| Interquartile 75% (IQ3) | 92.1% | 88.6% |
| Interquartile Range (IQR) | 6.8% | 28.8% |
| Standard Deviation (Sample) | 7.7% | 22.9% |
| Standard Deviation (Population) | 7.6% | 22.5% |
Similar Demographics by In Labor Force | Age 30-34
Demographics Similar to Albanians by In Labor Force | Age 30-34
In terms of in labor force | age 30-34, the demographic groups most similar to Albanians are Serbian (85.8%, a difference of 0.0%), Immigrants from Bosnia and Herzegovina (85.8%, a difference of 0.010%), Ugandan (85.8%, a difference of 0.010%), Norwegian (85.7%, a difference of 0.010%), and Immigrants from Greece (85.7%, a difference of 0.010%).
| Demographics | Rating | Rank | In Labor Force | Age 30-34 |
| Tsimshian | 100.0 /100 | #29 | Exceptional 85.8% |
| Immigrants | Hong Kong | 100.0 /100 | #30 | Exceptional 85.8% |
| Paraguayans | 99.9 /100 | #31 | Exceptional 85.8% |
| Cypriots | 99.9 /100 | #32 | Exceptional 85.8% |
| Immigrants | Bosnia and Herzegovina | 99.9 /100 | #33 | Exceptional 85.8% |
| Ugandans | 99.9 /100 | #34 | Exceptional 85.8% |
| Serbians | 99.9 /100 | #35 | Exceptional 85.8% |
| Albanians | 99.9 /100 | #36 | Exceptional 85.7% |
| Norwegians | 99.9 /100 | #37 | Exceptional 85.7% |
| Immigrants | Greece | 99.9 /100 | #38 | Exceptional 85.7% |
| Eastern Europeans | 99.9 /100 | #39 | Exceptional 85.7% |
| Turks | 99.9 /100 | #40 | Exceptional 85.7% |
| Immigrants | Italy | 99.9 /100 | #41 | Exceptional 85.7% |
| Zimbabweans | 99.8 /100 | #42 | Exceptional 85.6% |
| Immigrants | Lithuania | 99.8 /100 | #43 | Exceptional 85.6% |
Demographics Similar to Colville by In Labor Force | Age 30-34
In terms of in labor force | age 30-34, the demographic groups most similar to Colville are Seminole (80.8%, a difference of 0.19%), Dutch West Indian (81.0%, a difference of 0.41%), Sioux (80.4%, a difference of 0.41%), Creek (80.4%, a difference of 0.41%), and Cheyenne (81.1%, a difference of 0.57%).
| Demographics | Rating | Rank | In Labor Force | Age 30-34 |
| Yaqui | 0.0 /100 | #320 | Tragic 81.4% |
| Alaska Natives | 0.0 /100 | #321 | Tragic 81.3% |
| Puerto Ricans | 0.0 /100 | #322 | Tragic 81.2% |
| Paiute | 0.0 /100 | #323 | Tragic 81.2% |
| Cheyenne | 0.0 /100 | #324 | Tragic 81.1% |
| Dutch West Indians | 0.0 /100 | #325 | Tragic 81.0% |
| Seminole | 0.0 /100 | #326 | Tragic 80.8% |
| Colville | 0.0 /100 | #327 | Tragic 80.7% |
| Sioux | 0.0 /100 | #328 | Tragic 80.4% |
| Creek | 0.0 /100 | #329 | Tragic 80.4% |
| Pueblo | 0.0 /100 | #330 | Tragic 80.0% |
| Houma | 0.0 /100 | #331 | Tragic 79.9% |
| Kiowa | 0.0 /100 | #332 | Tragic 79.8% |
| Inupiat | 0.0 /100 | #333 | Tragic 79.7% |
| Hopi | 0.0 /100 | #334 | Tragic 79.3% |