Burmese vs Cape Verdean Unemployment Among Women with Children Under 6 years
COMPARE
Burmese
Cape Verdean
Unemployment Among Women with Children Under 6 years
Unemployment Among Women with Children Under 6 years Comparison
Burmese
Cape Verdeans
6.5%
UNEMPLOYMENT AMONG WOMEN WITH CHILDREN UNDER 6 YEARS
100.0/ 100
METRIC RATING
21st/ 347
METRIC RANK
5.9%
UNEMPLOYMENT AMONG WOMEN WITH CHILDREN UNDER 6 YEARS
100.0/ 100
METRIC RATING
5th/ 347
METRIC RANK
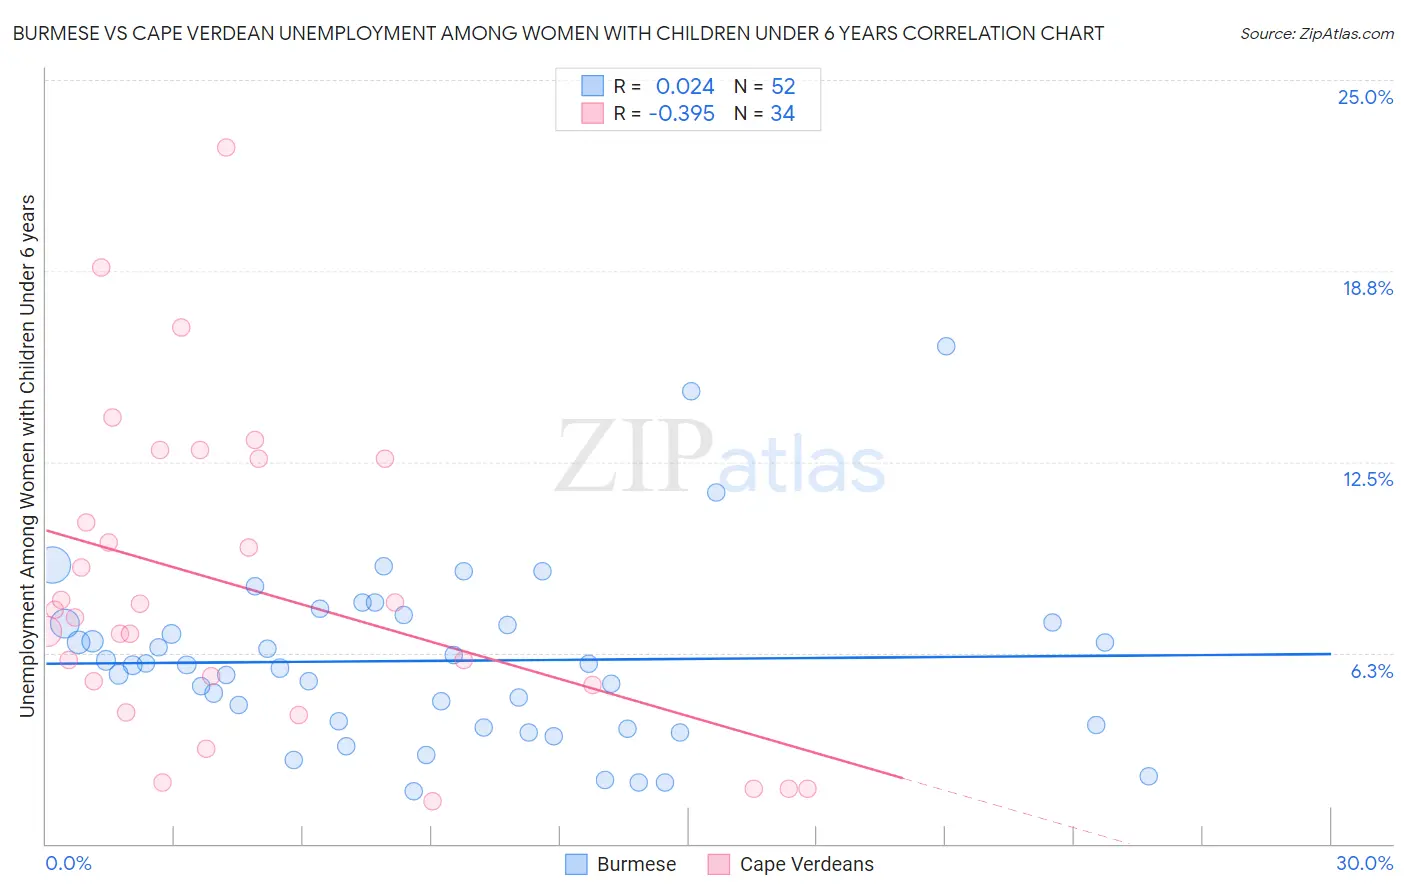
Burmese vs Cape Verdean Unemployment Among Women with Children Under 6 years Correlation Chart
The statistical analysis conducted on geographies consisting of 339,459,129 people shows no correlation between the proportion of Burmese and unemployment rate among women with children under the age of 6 in the United States with a correlation coefficient (R) of 0.024 and weighted average of 6.5%. Similarly, the statistical analysis conducted on geographies consisting of 96,300,007 people shows a mild negative correlation between the proportion of Cape Verdeans and unemployment rate among women with children under the age of 6 in the United States with a correlation coefficient (R) of -0.395 and weighted average of 5.9%, a difference of 9.0%.
Unemployment Among Women with Children Under 6 years Correlation Summary
| Measurement | Burmese | Cape Verdean |
| Minimum | 1.7% | 1.4% |
| Maximum | 16.3% | 22.8% |
| Range | 14.6% | 21.4% |
| Mean | 6.0% | 8.3% |
| Median | 5.9% | 7.5% |
| Interquartile 25% (IQ1) | 3.8% | 5.2% |
| Interquartile 75% (IQ3) | 7.2% | 12.6% |
| Interquartile Range (IQR) | 3.4% | 7.4% |
| Standard Deviation (Sample) | 2.9% | 5.1% |
| Standard Deviation (Population) | 2.9% | 5.0% |
Demographics Similar to Burmese and Cape Verdeans by Unemployment Among Women with Children Under 6 years
In terms of unemployment among women with children under 6 years, the demographic groups most similar to Burmese are Ute (6.5%, a difference of 0.050%), Mongolian (6.5%, a difference of 0.10%), Immigrants from Korea (6.5%, a difference of 0.42%), Assyrian/Chaldean/Syriac (6.5%, a difference of 0.43%), and Bulgarian (6.5%, a difference of 0.62%). Similarly, the demographic groups most similar to Cape Verdeans are Cambodian (5.9%, a difference of 1.0%), Immigrants from Taiwan (6.0%, a difference of 1.7%), Okinawan (5.8%, a difference of 1.9%), Taiwanese (6.1%, a difference of 2.2%), and Immigrants from India (6.1%, a difference of 2.7%).
| Demographics | Rating | Rank | Unemployment Among Women with Children Under 6 years |
| Okinawans | 100.0 /100 | #3 | Exceptional 5.8% |
| Cambodians | 100.0 /100 | #4 | Exceptional 5.9% |
| Cape Verdeans | 100.0 /100 | #5 | Exceptional 5.9% |
| Immigrants | Taiwan | 100.0 /100 | #6 | Exceptional 6.0% |
| Taiwanese | 100.0 /100 | #7 | Exceptional 6.1% |
| Immigrants | India | 100.0 /100 | #8 | Exceptional 6.1% |
| Filipinos | 100.0 /100 | #9 | Exceptional 6.1% |
| Immigrants | China | 100.0 /100 | #10 | Exceptional 6.2% |
| Indians (Asian) | 100.0 /100 | #11 | Exceptional 6.3% |
| Immigrants | Singapore | 100.0 /100 | #12 | Exceptional 6.3% |
| Immigrants | Eastern Asia | 100.0 /100 | #13 | Exceptional 6.3% |
| Immigrants | Bulgaria | 100.0 /100 | #14 | Exceptional 6.3% |
| Thais | 100.0 /100 | #15 | Exceptional 6.3% |
| Immigrants | Uzbekistan | 100.0 /100 | #16 | Exceptional 6.3% |
| Immigrants | Malaysia | 100.0 /100 | #17 | Exceptional 6.4% |
| Assyrians/Chaldeans/Syriacs | 100.0 /100 | #18 | Exceptional 6.5% |
| Mongolians | 100.0 /100 | #19 | Exceptional 6.5% |
| Ute | 100.0 /100 | #20 | Exceptional 6.5% |
| Burmese | 100.0 /100 | #21 | Exceptional 6.5% |
| Immigrants | Korea | 100.0 /100 | #22 | Exceptional 6.5% |
| Bulgarians | 100.0 /100 | #23 | Exceptional 6.5% |