Albanian vs Cape Verdean Unemployment Among Ages 65 to 74 years
COMPARE
Albanian
Cape Verdean
Unemployment Among Ages 65 to 74 years
Unemployment Among Ages 65 to 74 years Comparison
Albanians
Cape Verdeans
5.4%
UNEMPLOYMENT AMONG AGES 65 TO 74 YEARS
17.8/ 100
METRIC RATING
198th/ 347
METRIC RANK
5.6%
UNEMPLOYMENT AMONG AGES 65 TO 74 YEARS
0.7/ 100
METRIC RATING
250th/ 347
METRIC RANK
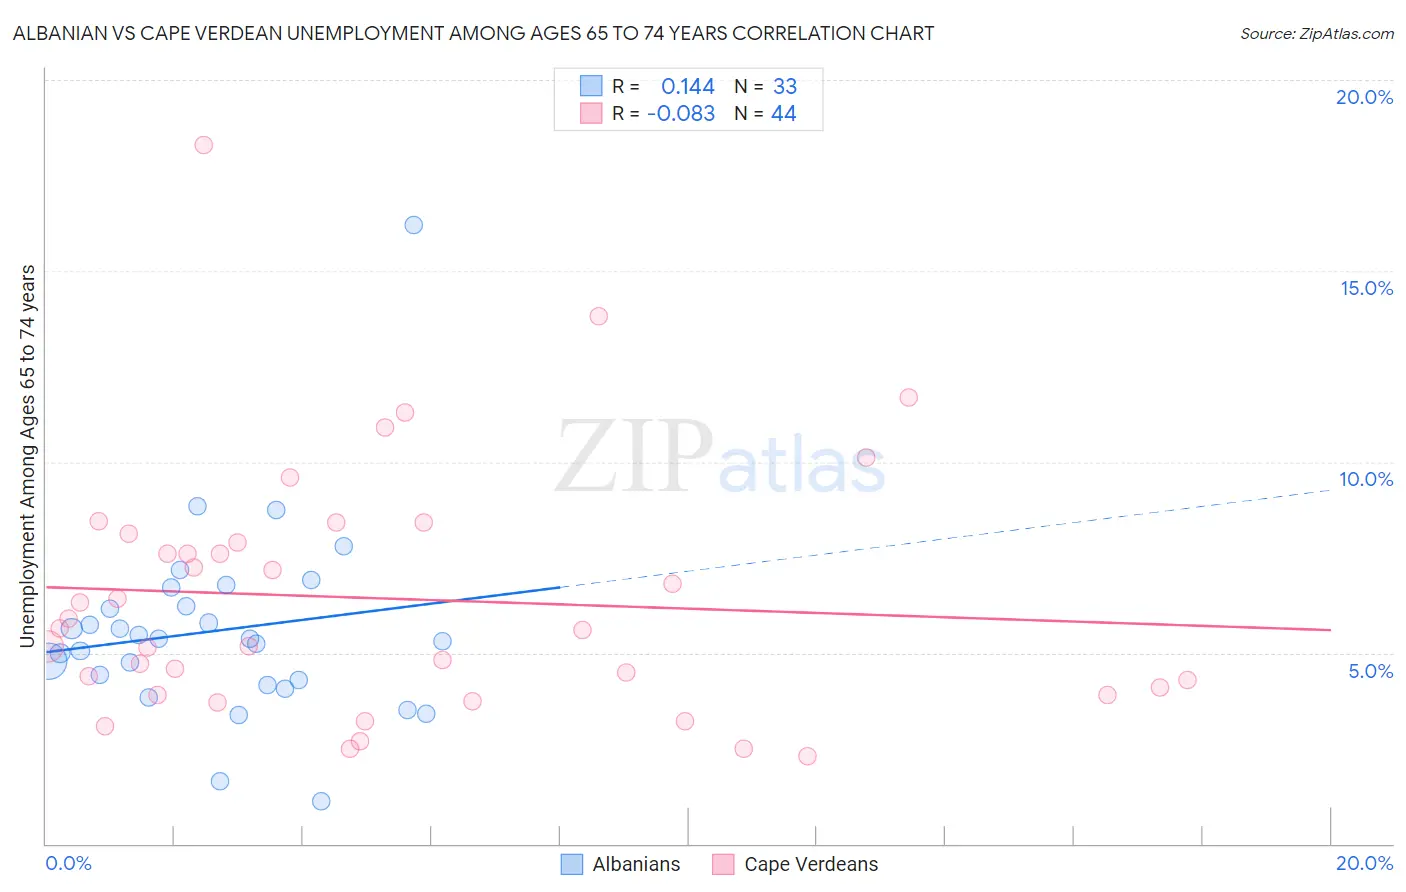
Albanian vs Cape Verdean Unemployment Among Ages 65 to 74 years Correlation Chart
The statistical analysis conducted on geographies consisting of 179,712,843 people shows a poor positive correlation between the proportion of Albanians and unemployment rate among population between the ages 65 and 74 in the United States with a correlation coefficient (R) of 0.144 and weighted average of 5.4%. Similarly, the statistical analysis conducted on geographies consisting of 103,296,098 people shows a slight negative correlation between the proportion of Cape Verdeans and unemployment rate among population between the ages 65 and 74 in the United States with a correlation coefficient (R) of -0.083 and weighted average of 5.6%, a difference of 2.8%.
Unemployment Among Ages 65 to 74 years Correlation Summary
| Measurement | Albanian | Cape Verdean |
| Minimum | 1.1% | 2.3% |
| Maximum | 16.2% | 18.3% |
| Range | 15.1% | 16.0% |
| Mean | 5.6% | 6.4% |
| Median | 5.4% | 5.6% |
| Interquartile 25% (IQ1) | 4.2% | 4.0% |
| Interquartile 75% (IQ3) | 6.5% | 8.0% |
| Interquartile Range (IQR) | 2.2% | 4.0% |
| Standard Deviation (Sample) | 2.6% | 3.3% |
| Standard Deviation (Population) | 2.5% | 3.3% |
Similar Demographics by Unemployment Among Ages 65 to 74 years
Demographics Similar to Albanians by Unemployment Among Ages 65 to 74 years
In terms of unemployment among ages 65 to 74 years, the demographic groups most similar to Albanians are Immigrants from Belgium (5.4%, a difference of 0.10%), Colville (5.4%, a difference of 0.14%), Immigrants from Pakistan (5.4%, a difference of 0.16%), Costa Rican (5.4%, a difference of 0.17%), and Immigrants from Western Asia (5.4%, a difference of 0.18%).
| Demographics | Rating | Rank | Unemployment Among Ages 65 to 74 years |
| Immigrants | Egypt | 26.5 /100 | #191 | Fair 5.4% |
| Maltese | 26.4 /100 | #192 | Fair 5.4% |
| Cherokee | 25.8 /100 | #193 | Fair 5.4% |
| Immigrants | Denmark | 24.7 /100 | #194 | Fair 5.4% |
| Immigrants | China | 24.2 /100 | #195 | Fair 5.4% |
| Costa Ricans | 21.1 /100 | #196 | Fair 5.4% |
| Colville | 20.4 /100 | #197 | Fair 5.4% |
| Albanians | 17.8 /100 | #198 | Poor 5.4% |
| Immigrants | Belgium | 16.2 /100 | #199 | Poor 5.4% |
| Immigrants | Pakistan | 15.2 /100 | #200 | Poor 5.4% |
| Immigrants | Western Asia | 14.9 /100 | #201 | Poor 5.4% |
| Sub-Saharan Africans | 14.4 /100 | #202 | Poor 5.4% |
| Argentineans | 14.3 /100 | #203 | Poor 5.4% |
| Seminole | 14.3 /100 | #204 | Poor 5.4% |
| Icelanders | 14.2 /100 | #205 | Poor 5.4% |
Demographics Similar to Cape Verdeans by Unemployment Among Ages 65 to 74 years
In terms of unemployment among ages 65 to 74 years, the demographic groups most similar to Cape Verdeans are Trinidadian and Tobagonian (5.6%, a difference of 0.080%), Immigrants (5.6%, a difference of 0.14%), Immigrants from Argentina (5.6%, a difference of 0.14%), Paraguayan (5.6%, a difference of 0.19%), and Immigrants from Micronesia (5.6%, a difference of 0.20%).
| Demographics | Rating | Rank | Unemployment Among Ages 65 to 74 years |
| Immigrants | Peru | 1.3 /100 | #243 | Tragic 5.6% |
| Immigrants | Micronesia | 0.9 /100 | #244 | Tragic 5.6% |
| Immigrants | Greece | 0.9 /100 | #245 | Tragic 5.6% |
| Paraguayans | 0.9 /100 | #246 | Tragic 5.6% |
| Immigrants | Immigrants | 0.9 /100 | #247 | Tragic 5.6% |
| Immigrants | Argentina | 0.9 /100 | #248 | Tragic 5.6% |
| Trinidadians and Tobagonians | 0.8 /100 | #249 | Tragic 5.6% |
| Cape Verdeans | 0.7 /100 | #250 | Tragic 5.6% |
| Brazilians | 0.5 /100 | #251 | Tragic 5.6% |
| Colombians | 0.5 /100 | #252 | Tragic 5.6% |
| Immigrants | Brazil | 0.5 /100 | #253 | Tragic 5.6% |
| Immigrants | Costa Rica | 0.5 /100 | #254 | Tragic 5.6% |
| Immigrants | Haiti | 0.4 /100 | #255 | Tragic 5.6% |
| Native Hawaiians | 0.4 /100 | #256 | Tragic 5.6% |
| Immigrants | Southern Europe | 0.3 /100 | #257 | Tragic 5.6% |