Alaskan Athabascan vs White/Caucasian 12th Grade, No Diploma
COMPARE
Alaskan Athabascan
White/Caucasian
12th Grade, No Diploma
12th Grade, No Diploma Comparison
Alaskan Athabascans
Whites/Caucasians
92.3%
12TH GRADE, NO DIPLOMA
98.1/ 100
METRIC RATING
102nd/ 347
METRIC RANK
91.8%
12TH GRADE, NO DIPLOMA
91.6/ 100
METRIC RATING
125th/ 347
METRIC RANK
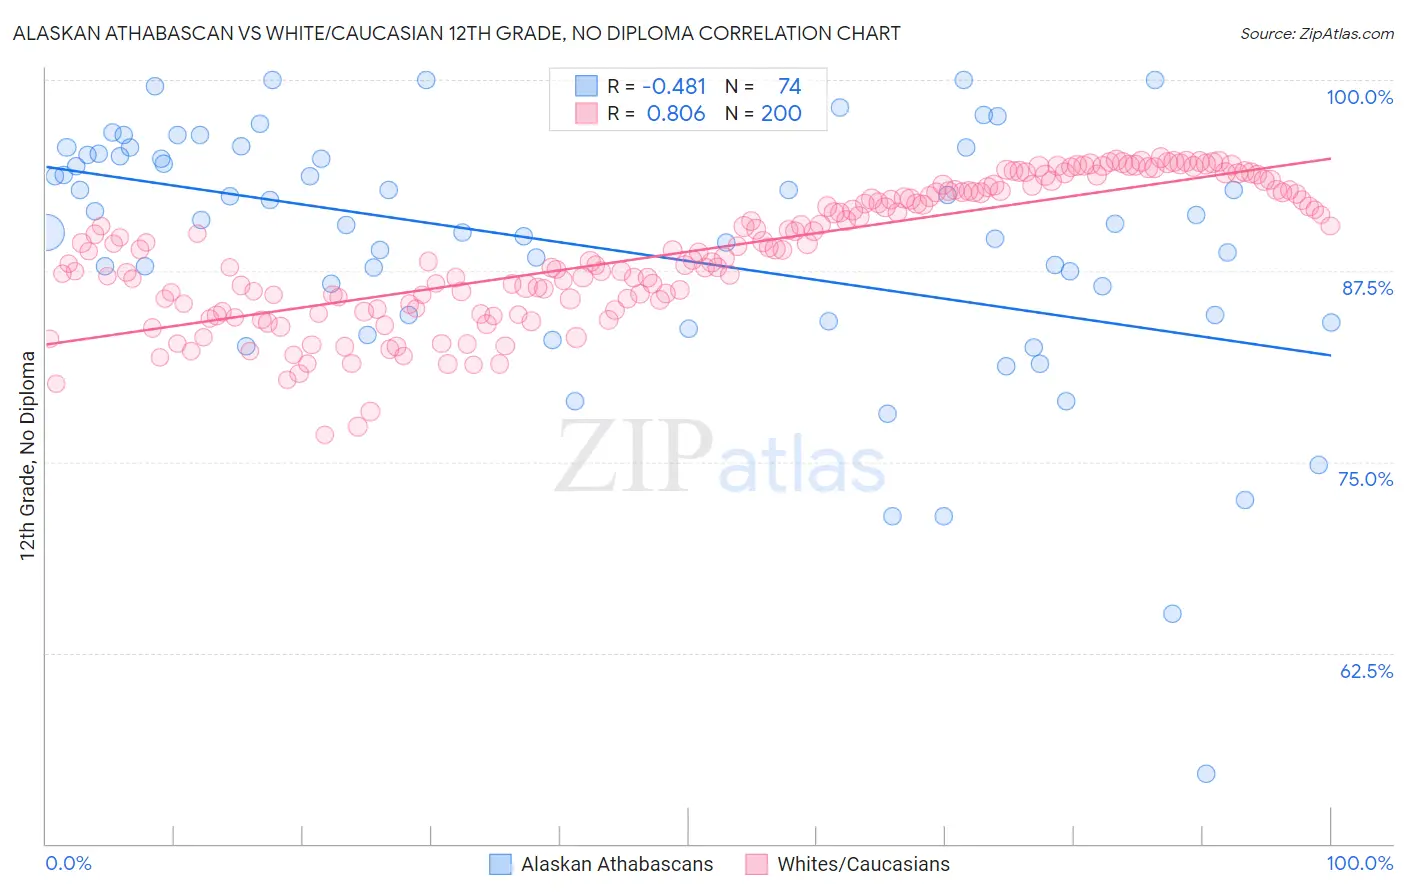
Alaskan Athabascan vs White/Caucasian 12th Grade, No Diploma Correlation Chart
The statistical analysis conducted on geographies consisting of 45,820,221 people shows a moderate negative correlation between the proportion of Alaskan Athabascans and percentage of population with at least 12th grade (no diploma) education in the United States with a correlation coefficient (R) of -0.481 and weighted average of 92.3%. Similarly, the statistical analysis conducted on geographies consisting of 585,243,214 people shows a very strong positive correlation between the proportion of Whites/Caucasians and percentage of population with at least 12th grade (no diploma) education in the United States with a correlation coefficient (R) of 0.806 and weighted average of 91.8%, a difference of 0.48%.
12th Grade, No Diploma Correlation Summary
| Measurement | Alaskan Athabascan | White/Caucasian |
| Minimum | 54.5% | 76.8% |
| Maximum | 100.0% | 94.9% |
| Range | 45.5% | 18.1% |
| Mean | 89.1% | 88.8% |
| Median | 90.7% | 88.9% |
| Interquartile 25% (IQ1) | 84.6% | 85.6% |
| Interquartile 75% (IQ3) | 95.1% | 92.7% |
| Interquartile Range (IQR) | 10.5% | 7.1% |
| Standard Deviation (Sample) | 8.5% | 4.4% |
| Standard Deviation (Population) | 8.5% | 4.4% |
Similar Demographics by 12th Grade, No Diploma
Demographics Similar to Alaskan Athabascans by 12th Grade, No Diploma
In terms of 12th grade, no diploma, the demographic groups most similar to Alaskan Athabascans are Swiss (92.3%, a difference of 0.0%), Immigrants from Norway (92.3%, a difference of 0.0%), Immigrants from Croatia (92.3%, a difference of 0.030%), Immigrants from Korea (92.3%, a difference of 0.040%), and Celtic (92.3%, a difference of 0.050%).
| Demographics | Rating | Rank | 12th Grade, No Diploma |
| Immigrants | North Macedonia | 98.5 /100 | #95 | Exceptional 92.3% |
| Icelanders | 98.5 /100 | #96 | Exceptional 92.3% |
| Celtics | 98.4 /100 | #97 | Exceptional 92.3% |
| Immigrants | Kuwait | 98.4 /100 | #98 | Exceptional 92.3% |
| Immigrants | Korea | 98.3 /100 | #99 | Exceptional 92.3% |
| Immigrants | Croatia | 98.3 /100 | #100 | Exceptional 92.3% |
| Swiss | 98.1 /100 | #101 | Exceptional 92.3% |
| Alaskan Athabascans | 98.1 /100 | #102 | Exceptional 92.3% |
| Immigrants | Norway | 98.1 /100 | #103 | Exceptional 92.3% |
| Lebanese | 97.6 /100 | #104 | Exceptional 92.2% |
| Immigrants | Belarus | 97.4 /100 | #105 | Exceptional 92.2% |
| Immigrants | Russia | 97.3 /100 | #106 | Exceptional 92.2% |
| Syrians | 97.2 /100 | #107 | Exceptional 92.2% |
| Jordanians | 97.2 /100 | #108 | Exceptional 92.2% |
| Immigrants | Hungary | 97.0 /100 | #109 | Exceptional 92.1% |
Demographics Similar to Whites/Caucasians by 12th Grade, No Diploma
In terms of 12th grade, no diploma, the demographic groups most similar to Whites/Caucasians are Immigrants from Ukraine (91.8%, a difference of 0.0%), Basque (91.8%, a difference of 0.010%), Immigrants from Jordan (91.8%, a difference of 0.020%), Egyptian (91.9%, a difference of 0.040%), and Mongolian (91.8%, a difference of 0.060%).
| Demographics | Rating | Rank | 12th Grade, No Diploma |
| Puget Sound Salish | 95.8 /100 | #118 | Exceptional 92.0% |
| Immigrants | Germany | 95.5 /100 | #119 | Exceptional 92.0% |
| Immigrants | Kazakhstan | 94.2 /100 | #120 | Exceptional 91.9% |
| Menominee | 93.5 /100 | #121 | Exceptional 91.9% |
| Ottawa | 93.1 /100 | #122 | Exceptional 91.9% |
| Egyptians | 92.5 /100 | #123 | Exceptional 91.9% |
| Immigrants | Ukraine | 91.6 /100 | #124 | Exceptional 91.8% |
| Whites/Caucasians | 91.6 /100 | #125 | Exceptional 91.8% |
| Basques | 91.3 /100 | #126 | Exceptional 91.8% |
| Immigrants | Jordan | 91.0 /100 | #127 | Exceptional 91.8% |
| Mongolians | 89.9 /100 | #128 | Excellent 91.8% |
| German Russians | 89.8 /100 | #129 | Excellent 91.8% |
| Assyrians/Chaldeans/Syriacs | 89.6 /100 | #130 | Excellent 91.8% |
| Albanians | 89.3 /100 | #131 | Excellent 91.8% |
| Immigrants | Eastern Asia | 89.3 /100 | #132 | Excellent 91.8% |