Alaskan Athabascan vs Immigrants from Portugal Unemployment Among Ages 45 to 54 years
COMPARE
Alaskan Athabascan
Immigrants from Portugal
Unemployment Among Ages 45 to 54 years
Unemployment Among Ages 45 to 54 years Comparison
Alaskan Athabascans
Immigrants from Portugal
8.5%
UNEMPLOYMENT AMONG AGES 45 TO 54 YEARS
0.0/ 100
METRIC RATING
342nd/ 347
METRIC RANK
5.2%
UNEMPLOYMENT AMONG AGES 45 TO 54 YEARS
0.0/ 100
METRIC RATING
290th/ 347
METRIC RANK
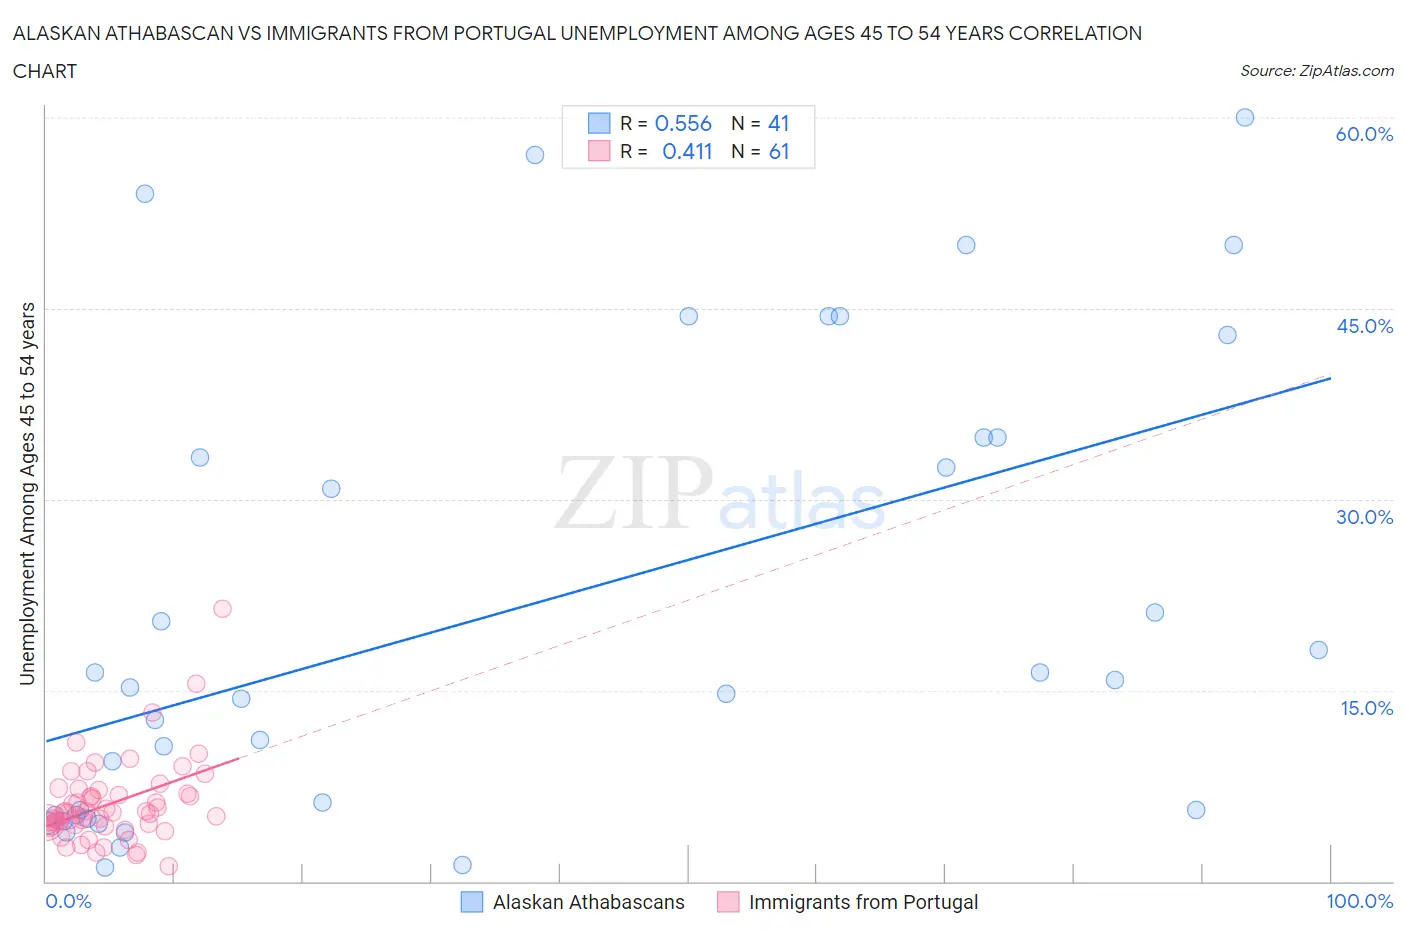
Alaskan Athabascan vs Immigrants from Portugal Unemployment Among Ages 45 to 54 years Correlation Chart
The statistical analysis conducted on geographies consisting of 45,433,240 people shows a substantial positive correlation between the proportion of Alaskan Athabascans and unemployment rate among population between the ages 45 and 54 in the United States with a correlation coefficient (R) of 0.556 and weighted average of 8.5%. Similarly, the statistical analysis conducted on geographies consisting of 172,906,656 people shows a moderate positive correlation between the proportion of Immigrants from Portugal and unemployment rate among population between the ages 45 and 54 in the United States with a correlation coefficient (R) of 0.411 and weighted average of 5.2%, a difference of 62.6%.
Unemployment Among Ages 45 to 54 years Correlation Summary
| Measurement | Alaskan Athabascan | Immigrants from Portugal |
| Minimum | 1.1% | 1.2% |
| Maximum | 60.0% | 21.4% |
| Range | 58.9% | 20.2% |
| Mean | 21.2% | 6.1% |
| Median | 15.2% | 5.4% |
| Interquartile 25% (IQ1) | 5.2% | 4.4% |
| Interquartile 75% (IQ3) | 34.9% | 7.0% |
| Interquartile Range (IQR) | 29.7% | 2.6% |
| Standard Deviation (Sample) | 18.1% | 3.3% |
| Standard Deviation (Population) | 17.8% | 3.2% |
Similar Demographics by Unemployment Among Ages 45 to 54 years
Demographics Similar to Alaskan Athabascans by Unemployment Among Ages 45 to 54 years
In terms of unemployment among ages 45 to 54 years, the demographic groups most similar to Alaskan Athabascans are Inupiat (9.2%, a difference of 8.6%), Paiute (7.8%, a difference of 8.8%), Yuman (9.5%, a difference of 12.2%), Hopi (7.5%, a difference of 12.6%), and Arapaho (7.5%, a difference of 13.1%).
| Demographics | Rating | Rank | Unemployment Among Ages 45 to 54 years |
| Immigrants | Yemen | 0.0 /100 | #333 | Tragic 6.5% |
| Sioux | 0.0 /100 | #334 | Tragic 6.6% |
| Navajo | 0.0 /100 | #335 | Tragic 6.7% |
| Puerto Ricans | 0.0 /100 | #336 | Tragic 6.8% |
| Apache | 0.0 /100 | #337 | Tragic 7.0% |
| Colville | 0.0 /100 | #338 | Tragic 7.4% |
| Arapaho | 0.0 /100 | #339 | Tragic 7.5% |
| Hopi | 0.0 /100 | #340 | Tragic 7.5% |
| Paiute | 0.0 /100 | #341 | Tragic 7.8% |
| Alaskan Athabascans | 0.0 /100 | #342 | Tragic 8.5% |
| Inupiat | 0.0 /100 | #343 | Tragic 9.2% |
| Yuman | 0.0 /100 | #344 | Tragic 9.5% |
| Cheyenne | 0.0 /100 | #345 | Tragic 10.6% |
| Yup'ik | 0.0 /100 | #346 | Tragic 11.9% |
| Crow | 0.0 /100 | #347 | Tragic 13.7% |
Demographics Similar to Immigrants from Portugal by Unemployment Among Ages 45 to 54 years
In terms of unemployment among ages 45 to 54 years, the demographic groups most similar to Immigrants from Portugal are Armenian (5.2%, a difference of 0.0%), Immigrants from Haiti (5.2%, a difference of 0.16%), Trinidadian and Tobagonian (5.2%, a difference of 0.24%), Immigrants from Senegal (5.2%, a difference of 0.25%), and Immigrants from Caribbean (5.2%, a difference of 0.56%).
| Demographics | Rating | Rank | Unemployment Among Ages 45 to 54 years |
| Hispanics or Latinos | 0.0 /100 | #283 | Tragic 5.1% |
| Kiowa | 0.0 /100 | #284 | Tragic 5.1% |
| Iroquois | 0.0 /100 | #285 | Tragic 5.1% |
| Senegalese | 0.0 /100 | #286 | Tragic 5.1% |
| Haitians | 0.0 /100 | #287 | Tragic 5.2% |
| Immigrants | Caribbean | 0.0 /100 | #288 | Tragic 5.2% |
| Immigrants | Haiti | 0.0 /100 | #289 | Tragic 5.2% |
| Immigrants | Portugal | 0.0 /100 | #290 | Tragic 5.2% |
| Armenians | 0.0 /100 | #291 | Tragic 5.2% |
| Trinidadians and Tobagonians | 0.0 /100 | #292 | Tragic 5.2% |
| Immigrants | Senegal | 0.0 /100 | #293 | Tragic 5.2% |
| Belizeans | 0.0 /100 | #294 | Tragic 5.2% |
| Jamaicans | 0.0 /100 | #295 | Tragic 5.3% |
| Aleuts | 0.0 /100 | #296 | Tragic 5.3% |
| West Indians | 0.0 /100 | #297 | Tragic 5.3% |