Immigrants from Ecuador vs Immigrants from Portugal Unemployment Among Ages 45 to 54 years
COMPARE
Immigrants from Ecuador
Immigrants from Portugal
Unemployment Among Ages 45 to 54 years
Unemployment Among Ages 45 to 54 years Comparison
Immigrants from Ecuador
Immigrants from Portugal
5.3%
UNEMPLOYMENT AMONG AGES 45 TO 54 YEARS
0.0/ 100
METRIC RATING
302nd/ 347
METRIC RANK
5.2%
UNEMPLOYMENT AMONG AGES 45 TO 54 YEARS
0.0/ 100
METRIC RATING
290th/ 347
METRIC RANK
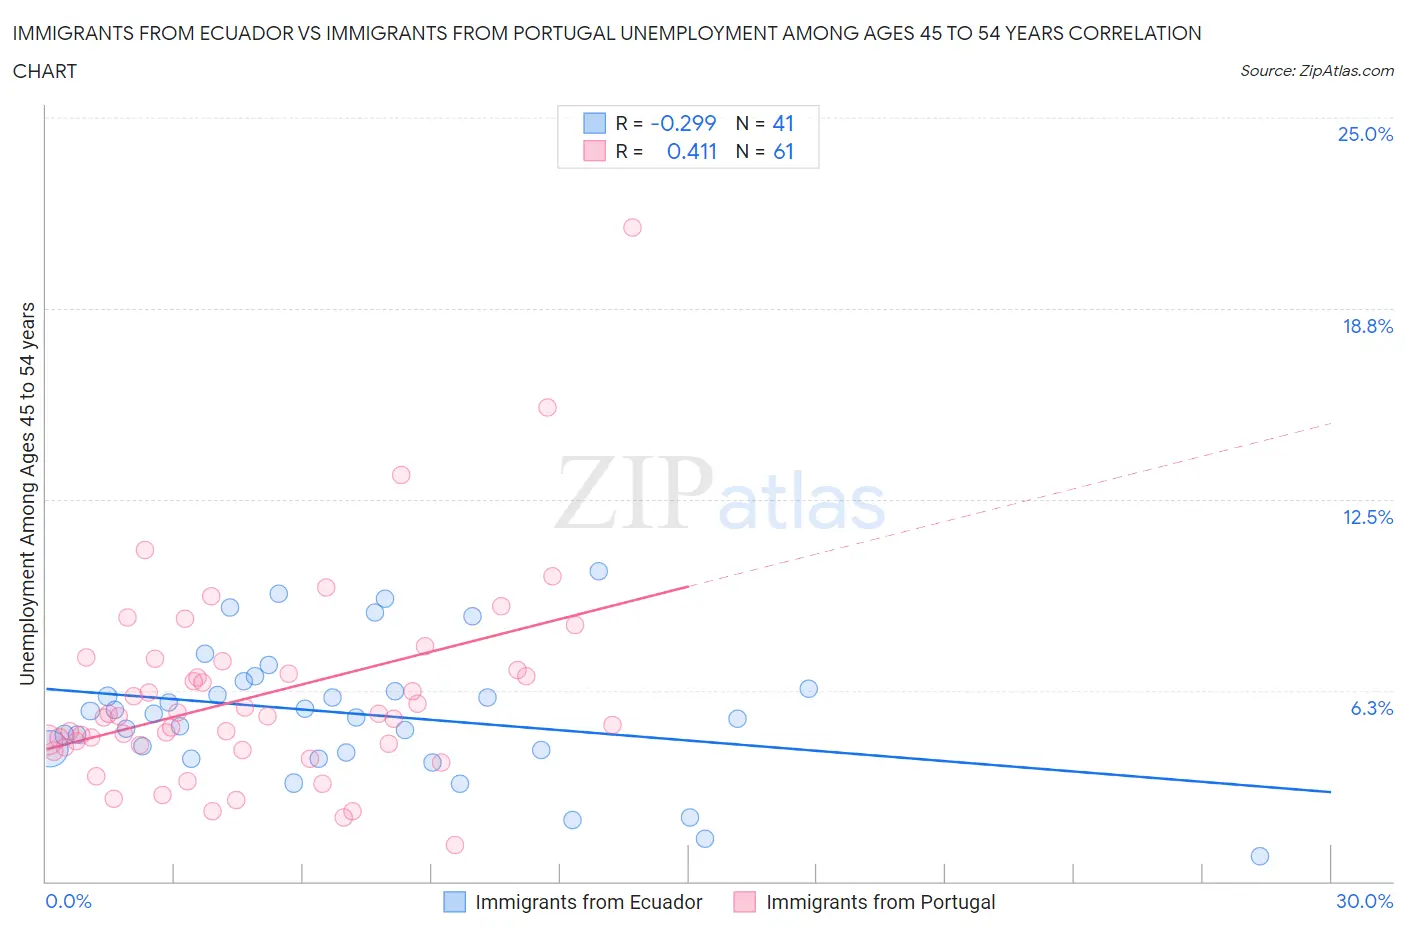
Immigrants from Ecuador vs Immigrants from Portugal Unemployment Among Ages 45 to 54 years Correlation Chart
The statistical analysis conducted on geographies consisting of 267,492,457 people shows a weak negative correlation between the proportion of Immigrants from Ecuador and unemployment rate among population between the ages 45 and 54 in the United States with a correlation coefficient (R) of -0.299 and weighted average of 5.3%. Similarly, the statistical analysis conducted on geographies consisting of 172,906,656 people shows a moderate positive correlation between the proportion of Immigrants from Portugal and unemployment rate among population between the ages 45 and 54 in the United States with a correlation coefficient (R) of 0.411 and weighted average of 5.2%, a difference of 2.6%.
Unemployment Among Ages 45 to 54 years Correlation Summary
| Measurement | Immigrants from Ecuador | Immigrants from Portugal |
| Minimum | 0.80% | 1.2% |
| Maximum | 10.1% | 21.4% |
| Range | 9.3% | 20.2% |
| Mean | 5.5% | 6.1% |
| Median | 5.5% | 5.4% |
| Interquartile 25% (IQ1) | 4.3% | 4.4% |
| Interquartile 75% (IQ3) | 6.4% | 7.0% |
| Interquartile Range (IQR) | 2.2% | 2.6% |
| Standard Deviation (Sample) | 2.1% | 3.3% |
| Standard Deviation (Population) | 2.1% | 3.2% |
Demographics Similar to Immigrants from Ecuador and Immigrants from Portugal by Unemployment Among Ages 45 to 54 years
In terms of unemployment among ages 45 to 54 years, the demographic groups most similar to Immigrants from Ecuador are Immigrants from Belize (5.3%, a difference of 0.10%), Immigrants from Jamaica (5.4%, a difference of 0.27%), Immigrants from West Indies (5.4%, a difference of 0.45%), Immigrants from Bangladesh (5.4%, a difference of 0.61%), and Menominee (5.3%, a difference of 0.85%). Similarly, the demographic groups most similar to Immigrants from Portugal are Armenian (5.2%, a difference of 0.0%), Immigrants from Haiti (5.2%, a difference of 0.16%), Trinidadian and Tobagonian (5.2%, a difference of 0.24%), Immigrants from Senegal (5.2%, a difference of 0.25%), and Immigrants from Caribbean (5.2%, a difference of 0.56%).
| Demographics | Rating | Rank | Unemployment Among Ages 45 to 54 years |
| Senegalese | 0.0 /100 | #286 | Tragic 5.1% |
| Haitians | 0.0 /100 | #287 | Tragic 5.2% |
| Immigrants | Caribbean | 0.0 /100 | #288 | Tragic 5.2% |
| Immigrants | Haiti | 0.0 /100 | #289 | Tragic 5.2% |
| Immigrants | Portugal | 0.0 /100 | #290 | Tragic 5.2% |
| Armenians | 0.0 /100 | #291 | Tragic 5.2% |
| Trinidadians and Tobagonians | 0.0 /100 | #292 | Tragic 5.2% |
| Immigrants | Senegal | 0.0 /100 | #293 | Tragic 5.2% |
| Belizeans | 0.0 /100 | #294 | Tragic 5.2% |
| Jamaicans | 0.0 /100 | #295 | Tragic 5.3% |
| Aleuts | 0.0 /100 | #296 | Tragic 5.3% |
| West Indians | 0.0 /100 | #297 | Tragic 5.3% |
| Immigrants | Trinidad and Tobago | 0.0 /100 | #298 | Tragic 5.3% |
| Ecuadorians | 0.0 /100 | #299 | Tragic 5.3% |
| Central American Indians | 0.0 /100 | #300 | Tragic 5.3% |
| Menominee | 0.0 /100 | #301 | Tragic 5.3% |
| Immigrants | Ecuador | 0.0 /100 | #302 | Tragic 5.3% |
| Immigrants | Belize | 0.0 /100 | #303 | Tragic 5.3% |
| Immigrants | Jamaica | 0.0 /100 | #304 | Tragic 5.4% |
| Immigrants | West Indies | 0.0 /100 | #305 | Tragic 5.4% |
| Immigrants | Bangladesh | 0.0 /100 | #306 | Tragic 5.4% |