Alaskan Athabascan vs Scottish Unemployment Among Ages 45 to 54 years
COMPARE
Alaskan Athabascan
Scottish
Unemployment Among Ages 45 to 54 years
Unemployment Among Ages 45 to 54 years Comparison
Alaskan Athabascans
Scottish
8.5%
UNEMPLOYMENT AMONG AGES 45 TO 54 YEARS
0.0/ 100
METRIC RATING
342nd/ 347
METRIC RANK
4.1%
UNEMPLOYMENT AMONG AGES 45 TO 54 YEARS
99.9/ 100
METRIC RATING
26th/ 347
METRIC RANK
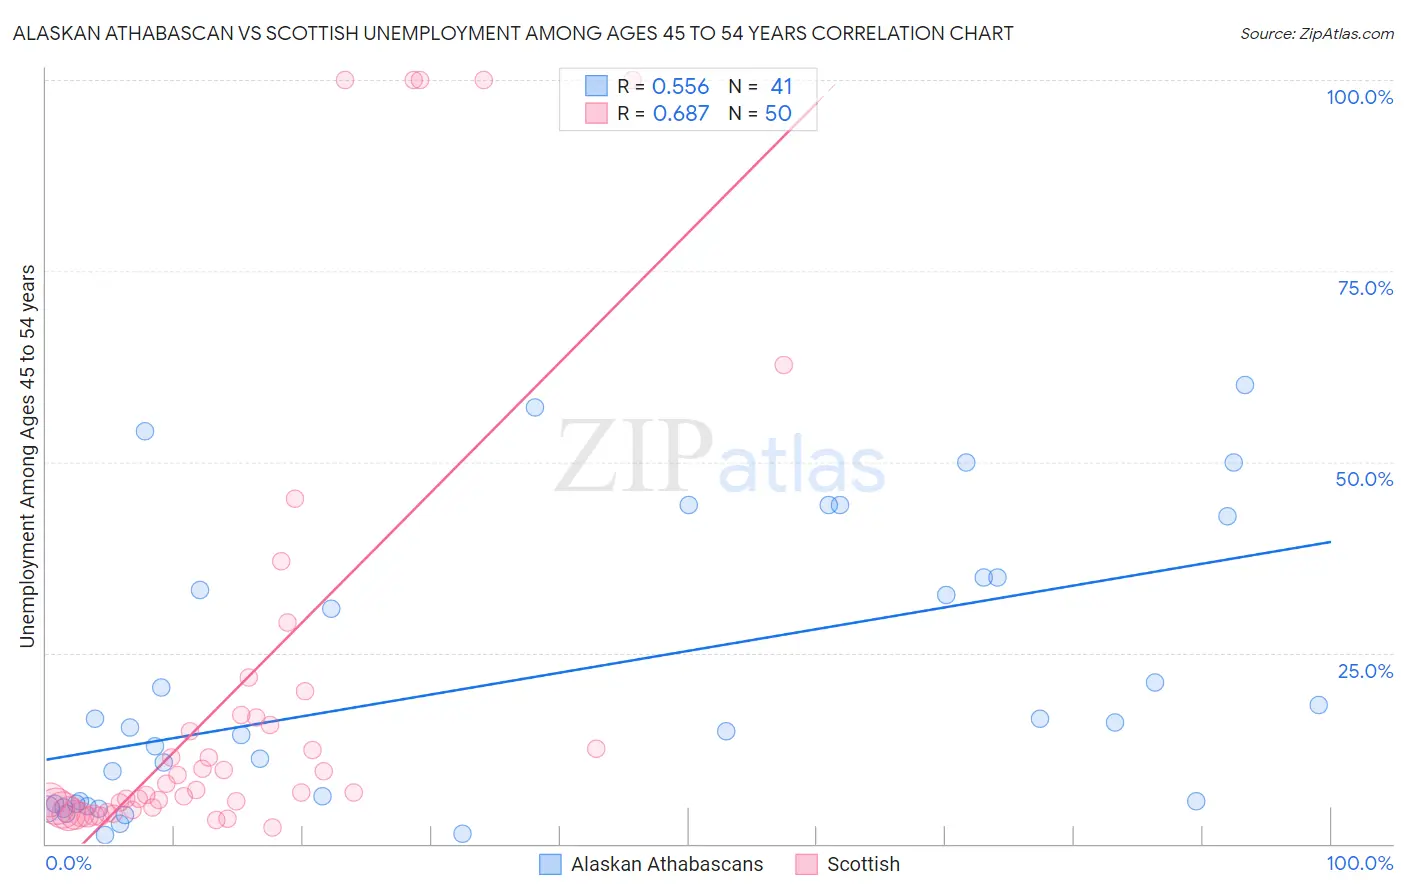
Alaskan Athabascan vs Scottish Unemployment Among Ages 45 to 54 years Correlation Chart
The statistical analysis conducted on geographies consisting of 45,433,240 people shows a substantial positive correlation between the proportion of Alaskan Athabascans and unemployment rate among population between the ages 45 and 54 in the United States with a correlation coefficient (R) of 0.556 and weighted average of 8.5%. Similarly, the statistical analysis conducted on geographies consisting of 524,336,478 people shows a significant positive correlation between the proportion of Scottish and unemployment rate among population between the ages 45 and 54 in the United States with a correlation coefficient (R) of 0.687 and weighted average of 4.1%, a difference of 105.3%.
Unemployment Among Ages 45 to 54 years Correlation Summary
| Measurement | Alaskan Athabascan | Scottish |
| Minimum | 1.1% | 2.0% |
| Maximum | 60.0% | 100.0% |
| Range | 58.9% | 98.0% |
| Mean | 21.2% | 19.9% |
| Median | 15.2% | 6.8% |
| Interquartile 25% (IQ1) | 5.2% | 4.5% |
| Interquartile 75% (IQ3) | 34.9% | 16.6% |
| Interquartile Range (IQR) | 29.7% | 12.1% |
| Standard Deviation (Sample) | 18.1% | 29.2% |
| Standard Deviation (Population) | 17.8% | 28.9% |
Similar Demographics by Unemployment Among Ages 45 to 54 years
Demographics Similar to Alaskan Athabascans by Unemployment Among Ages 45 to 54 years
In terms of unemployment among ages 45 to 54 years, the demographic groups most similar to Alaskan Athabascans are Inupiat (9.2%, a difference of 8.6%), Paiute (7.8%, a difference of 8.8%), Yuman (9.5%, a difference of 12.2%), Hopi (7.5%, a difference of 12.6%), and Arapaho (7.5%, a difference of 13.1%).
| Demographics | Rating | Rank | Unemployment Among Ages 45 to 54 years |
| Immigrants | Yemen | 0.0 /100 | #333 | Tragic 6.5% |
| Sioux | 0.0 /100 | #334 | Tragic 6.6% |
| Navajo | 0.0 /100 | #335 | Tragic 6.7% |
| Puerto Ricans | 0.0 /100 | #336 | Tragic 6.8% |
| Apache | 0.0 /100 | #337 | Tragic 7.0% |
| Colville | 0.0 /100 | #338 | Tragic 7.4% |
| Arapaho | 0.0 /100 | #339 | Tragic 7.5% |
| Hopi | 0.0 /100 | #340 | Tragic 7.5% |
| Paiute | 0.0 /100 | #341 | Tragic 7.8% |
| Alaskan Athabascans | 0.0 /100 | #342 | Tragic 8.5% |
| Inupiat | 0.0 /100 | #343 | Tragic 9.2% |
| Yuman | 0.0 /100 | #344 | Tragic 9.5% |
| Cheyenne | 0.0 /100 | #345 | Tragic 10.6% |
| Yup'ik | 0.0 /100 | #346 | Tragic 11.9% |
| Crow | 0.0 /100 | #347 | Tragic 13.7% |
Demographics Similar to Scottish by Unemployment Among Ages 45 to 54 years
In terms of unemployment among ages 45 to 54 years, the demographic groups most similar to Scottish are Bolivian (4.1%, a difference of 0.0%), Carpatho Rusyn (4.1%, a difference of 0.12%), Immigrants from Moldova (4.1%, a difference of 0.48%), Welsh (4.1%, a difference of 0.54%), and Belgian (4.1%, a difference of 0.68%).
| Demographics | Rating | Rank | Unemployment Among Ages 45 to 54 years |
| Swiss | 100.0 /100 | #19 | Exceptional 4.1% |
| English | 100.0 /100 | #20 | Exceptional 4.1% |
| Europeans | 100.0 /100 | #21 | Exceptional 4.1% |
| Yugoslavians | 100.0 /100 | #22 | Exceptional 4.1% |
| Bulgarians | 100.0 /100 | #23 | Exceptional 4.1% |
| Carpatho Rusyns | 100.0 /100 | #24 | Exceptional 4.1% |
| Bolivians | 99.9 /100 | #25 | Exceptional 4.1% |
| Scottish | 99.9 /100 | #26 | Exceptional 4.1% |
| Immigrants | Moldova | 99.9 /100 | #27 | Exceptional 4.1% |
| Welsh | 99.9 /100 | #28 | Exceptional 4.1% |
| Belgians | 99.9 /100 | #29 | Exceptional 4.1% |
| British | 99.9 /100 | #30 | Exceptional 4.1% |
| Bhutanese | 99.9 /100 | #31 | Exceptional 4.2% |
| Slovenes | 99.9 /100 | #32 | Exceptional 4.2% |
| Immigrants | South Central Asia | 99.9 /100 | #33 | Exceptional 4.2% |