Immigrants from Russia vs Immigrants from Portugal Unemployment Among Ages 45 to 54 years
COMPARE
Immigrants from Russia
Immigrants from Portugal
Unemployment Among Ages 45 to 54 years
Unemployment Among Ages 45 to 54 years Comparison
Immigrants from Russia
Immigrants from Portugal
4.5%
UNEMPLOYMENT AMONG AGES 45 TO 54 YEARS
48.2/ 100
METRIC RATING
179th/ 347
METRIC RANK
5.2%
UNEMPLOYMENT AMONG AGES 45 TO 54 YEARS
0.0/ 100
METRIC RATING
290th/ 347
METRIC RANK
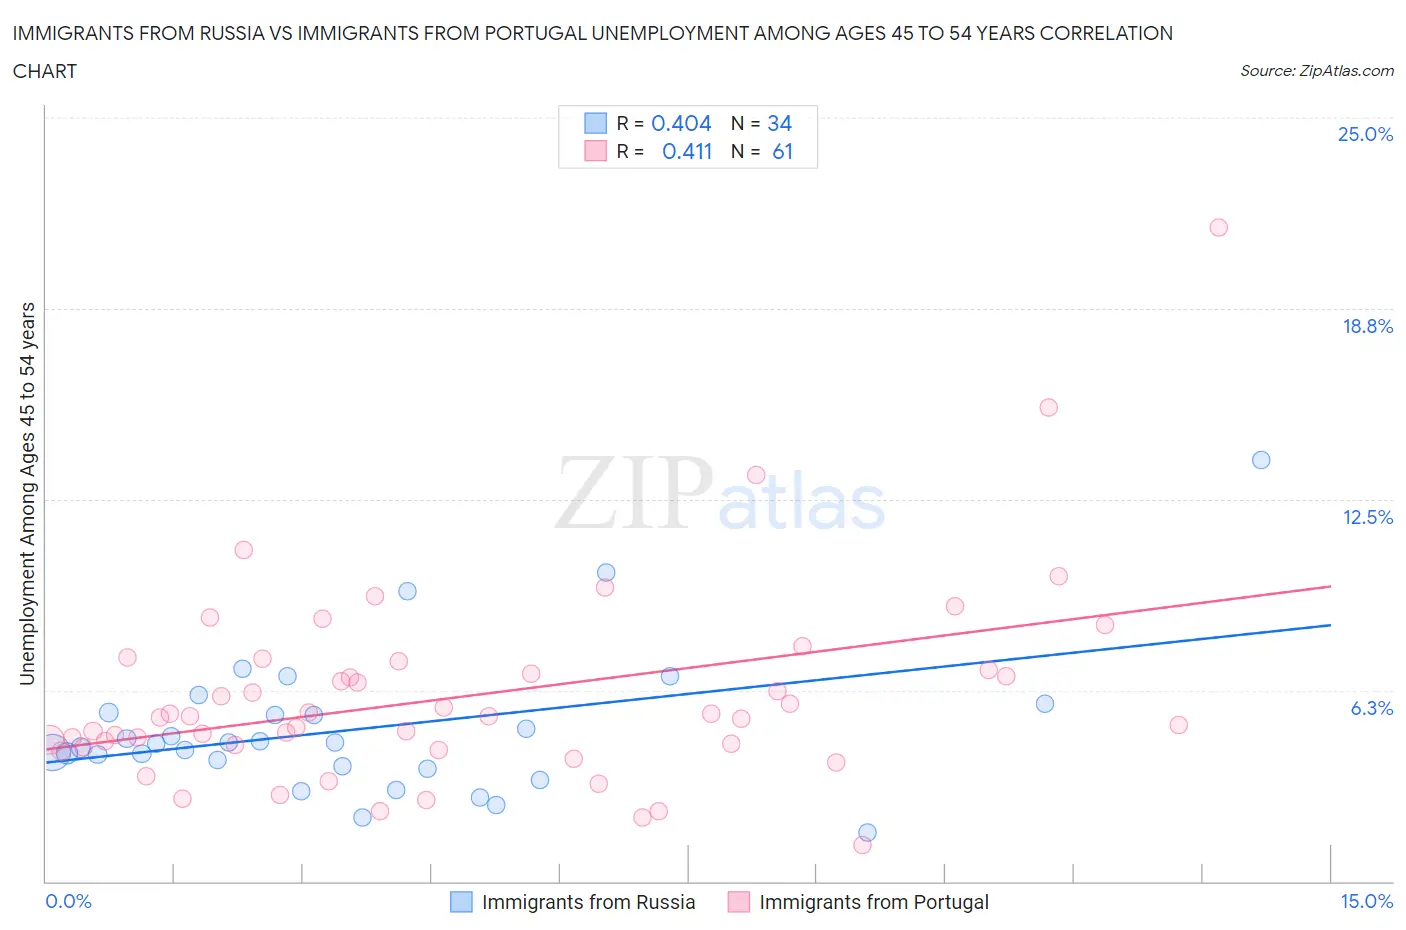
Immigrants from Russia vs Immigrants from Portugal Unemployment Among Ages 45 to 54 years Correlation Chart
The statistical analysis conducted on geographies consisting of 340,338,478 people shows a moderate positive correlation between the proportion of Immigrants from Russia and unemployment rate among population between the ages 45 and 54 in the United States with a correlation coefficient (R) of 0.404 and weighted average of 4.5%. Similarly, the statistical analysis conducted on geographies consisting of 172,906,656 people shows a moderate positive correlation between the proportion of Immigrants from Portugal and unemployment rate among population between the ages 45 and 54 in the United States with a correlation coefficient (R) of 0.411 and weighted average of 5.2%, a difference of 15.0%.
Unemployment Among Ages 45 to 54 years Correlation Summary
| Measurement | Immigrants from Russia | Immigrants from Portugal |
| Minimum | 1.6% | 1.2% |
| Maximum | 13.8% | 21.4% |
| Range | 12.2% | 20.2% |
| Mean | 5.0% | 6.1% |
| Median | 4.5% | 5.4% |
| Interquartile 25% (IQ1) | 3.8% | 4.4% |
| Interquartile 75% (IQ3) | 5.5% | 7.0% |
| Interquartile Range (IQR) | 1.7% | 2.6% |
| Standard Deviation (Sample) | 2.4% | 3.3% |
| Standard Deviation (Population) | 2.3% | 3.2% |
Similar Demographics by Unemployment Among Ages 45 to 54 years
Demographics Similar to Immigrants from Russia by Unemployment Among Ages 45 to 54 years
In terms of unemployment among ages 45 to 54 years, the demographic groups most similar to Immigrants from Russia are Immigrants from Australia (4.5%, a difference of 0.010%), Malaysian (4.5%, a difference of 0.030%), Puget Sound Salish (4.5%, a difference of 0.040%), Immigrants from Northern Africa (4.5%, a difference of 0.040%), and Immigrants from France (4.5%, a difference of 0.060%).
| Demographics | Rating | Rank | Unemployment Among Ages 45 to 54 years |
| Colombians | 53.3 /100 | #172 | Average 4.5% |
| Immigrants | Colombia | 52.0 /100 | #173 | Average 4.5% |
| Immigrants | Hungary | 50.0 /100 | #174 | Average 4.5% |
| Immigrants | France | 49.4 /100 | #175 | Average 4.5% |
| Puget Sound Salish | 49.1 /100 | #176 | Average 4.5% |
| Immigrants | Northern Africa | 49.0 /100 | #177 | Average 4.5% |
| Immigrants | Australia | 48.5 /100 | #178 | Average 4.5% |
| Immigrants | Russia | 48.2 /100 | #179 | Average 4.5% |
| Malaysians | 47.5 /100 | #180 | Average 4.5% |
| Immigrants | Poland | 47.0 /100 | #181 | Average 4.5% |
| Immigrants | China | 46.7 /100 | #182 | Average 4.5% |
| Sierra Leoneans | 46.7 /100 | #183 | Average 4.5% |
| Immigrants | Hong Kong | 45.9 /100 | #184 | Average 4.5% |
| Immigrants | Philippines | 41.0 /100 | #185 | Average 4.5% |
| Hawaiians | 39.1 /100 | #186 | Fair 4.5% |
Demographics Similar to Immigrants from Portugal by Unemployment Among Ages 45 to 54 years
In terms of unemployment among ages 45 to 54 years, the demographic groups most similar to Immigrants from Portugal are Armenian (5.2%, a difference of 0.0%), Immigrants from Haiti (5.2%, a difference of 0.16%), Trinidadian and Tobagonian (5.2%, a difference of 0.24%), Immigrants from Senegal (5.2%, a difference of 0.25%), and Immigrants from Caribbean (5.2%, a difference of 0.56%).
| Demographics | Rating | Rank | Unemployment Among Ages 45 to 54 years |
| Hispanics or Latinos | 0.0 /100 | #283 | Tragic 5.1% |
| Kiowa | 0.0 /100 | #284 | Tragic 5.1% |
| Iroquois | 0.0 /100 | #285 | Tragic 5.1% |
| Senegalese | 0.0 /100 | #286 | Tragic 5.1% |
| Haitians | 0.0 /100 | #287 | Tragic 5.2% |
| Immigrants | Caribbean | 0.0 /100 | #288 | Tragic 5.2% |
| Immigrants | Haiti | 0.0 /100 | #289 | Tragic 5.2% |
| Immigrants | Portugal | 0.0 /100 | #290 | Tragic 5.2% |
| Armenians | 0.0 /100 | #291 | Tragic 5.2% |
| Trinidadians and Tobagonians | 0.0 /100 | #292 | Tragic 5.2% |
| Immigrants | Senegal | 0.0 /100 | #293 | Tragic 5.2% |
| Belizeans | 0.0 /100 | #294 | Tragic 5.2% |
| Jamaicans | 0.0 /100 | #295 | Tragic 5.3% |
| Aleuts | 0.0 /100 | #296 | Tragic 5.3% |
| West Indians | 0.0 /100 | #297 | Tragic 5.3% |