Alaska Native vs Spanish American Indian Unemployment Among Ages 55 to 59 years
COMPARE
Alaska Native
Spanish American Indian
Unemployment Among Ages 55 to 59 years
Unemployment Among Ages 55 to 59 years Comparison
Alaska Natives
Spanish American Indians
6.2%
UNEMPLOYMENT AMONG AGES 55 TO 59 YEARS
0.0/ 100
METRIC RATING
330th/ 347
METRIC RANK
5.6%
UNEMPLOYMENT AMONG AGES 55 TO 59 YEARS
0.0/ 100
METRIC RATING
308th/ 347
METRIC RANK
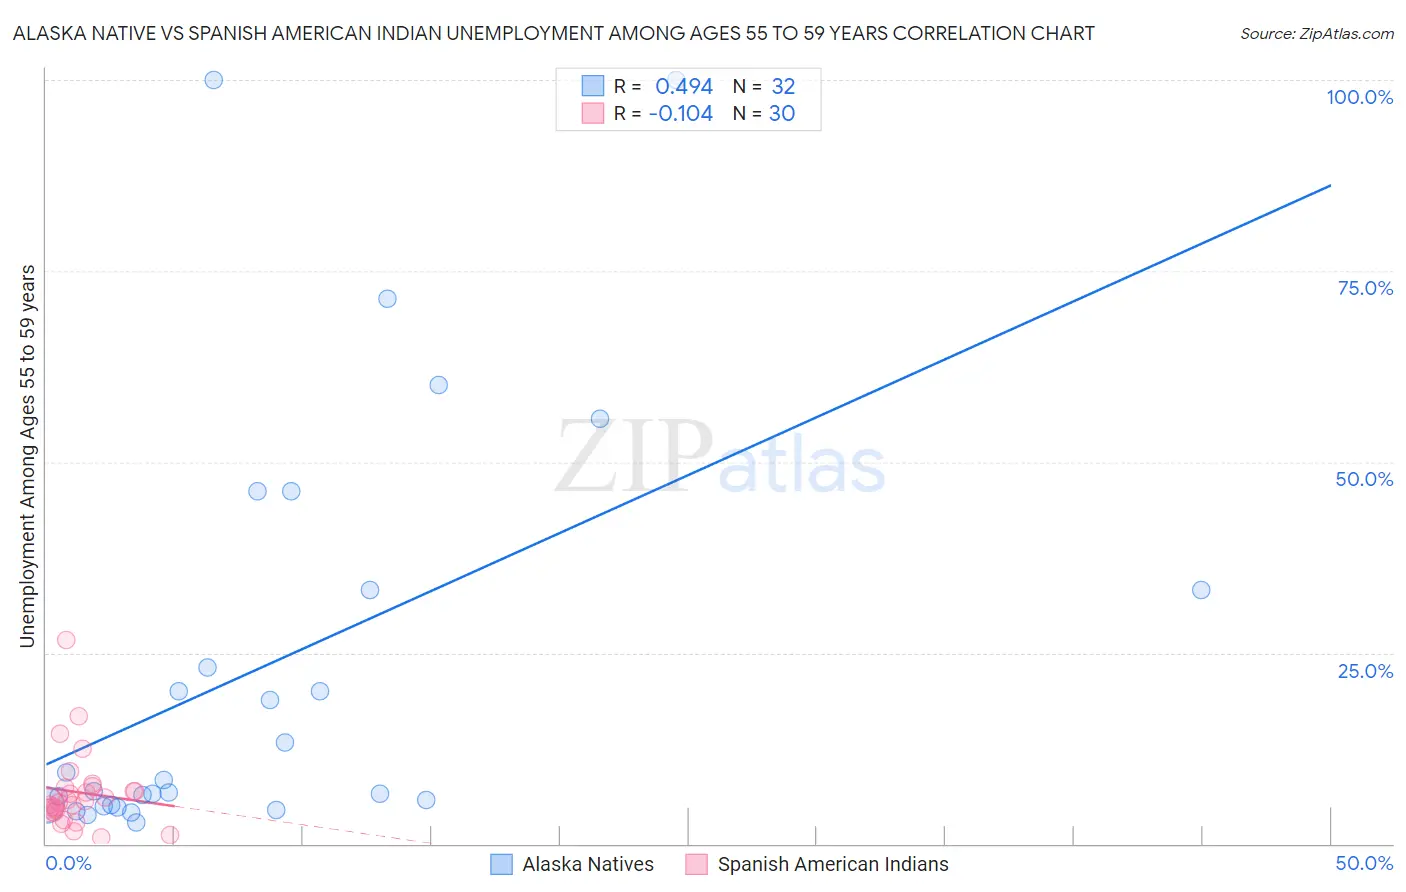
Alaska Native vs Spanish American Indian Unemployment Among Ages 55 to 59 years Correlation Chart
The statistical analysis conducted on geographies consisting of 74,675,263 people shows a moderate positive correlation between the proportion of Alaska Natives and unemployment rate among population between the ages 55 and 59 in the United States with a correlation coefficient (R) of 0.494 and weighted average of 6.2%. Similarly, the statistical analysis conducted on geographies consisting of 72,280,183 people shows a poor negative correlation between the proportion of Spanish American Indians and unemployment rate among population between the ages 55 and 59 in the United States with a correlation coefficient (R) of -0.104 and weighted average of 5.6%, a difference of 12.4%.
Unemployment Among Ages 55 to 59 years Correlation Summary
| Measurement | Alaska Native | Spanish American Indian |
| Minimum | 2.8% | 0.80% |
| Maximum | 100.0% | 26.7% |
| Range | 97.2% | 25.9% |
| Mean | 23.2% | 6.8% |
| Median | 7.6% | 5.5% |
| Interquartile 25% (IQ1) | 5.0% | 4.4% |
| Interquartile 75% (IQ3) | 33.3% | 7.4% |
| Interquartile Range (IQR) | 28.3% | 3.0% |
| Standard Deviation (Sample) | 27.5% | 5.2% |
| Standard Deviation (Population) | 27.1% | 5.1% |
Similar Demographics by Unemployment Among Ages 55 to 59 years
Demographics Similar to Alaska Natives by Unemployment Among Ages 55 to 59 years
In terms of unemployment among ages 55 to 59 years, the demographic groups most similar to Alaska Natives are Dominican (6.2%, a difference of 0.43%), Immigrants from Dominican Republic (6.3%, a difference of 0.68%), Yuman (6.1%, a difference of 1.9%), Arapaho (6.1%, a difference of 3.1%), and Aleut (6.4%, a difference of 3.1%).
| Demographics | Rating | Rank | Unemployment Among Ages 55 to 59 years |
| Immigrants | Bangladesh | 0.0 /100 | #323 | Tragic 5.9% |
| Vietnamese | 0.0 /100 | #324 | Tragic 5.9% |
| Immigrants | Armenia | 0.0 /100 | #325 | Tragic 6.0% |
| Natives/Alaskans | 0.0 /100 | #326 | Tragic 6.0% |
| Arapaho | 0.0 /100 | #327 | Tragic 6.1% |
| Yuman | 0.0 /100 | #328 | Tragic 6.1% |
| Dominicans | 0.0 /100 | #329 | Tragic 6.2% |
| Alaska Natives | 0.0 /100 | #330 | Tragic 6.2% |
| Immigrants | Dominican Republic | 0.0 /100 | #331 | Tragic 6.3% |
| Aleuts | 0.0 /100 | #332 | Tragic 6.4% |
| Pima | 0.0 /100 | #333 | Tragic 6.6% |
| Pueblo | 0.0 /100 | #334 | Tragic 6.7% |
| Colville | 0.0 /100 | #335 | Tragic 6.7% |
| Navajo | 0.0 /100 | #336 | Tragic 6.7% |
| Paiute | 0.0 /100 | #337 | Tragic 6.8% |
Demographics Similar to Spanish American Indians by Unemployment Among Ages 55 to 59 years
In terms of unemployment among ages 55 to 59 years, the demographic groups most similar to Spanish American Indians are Immigrants from Belize (5.5%, a difference of 0.50%), Nepalese (5.6%, a difference of 0.58%), Immigrants from Cabo Verde (5.5%, a difference of 0.72%), Immigrants from Portugal (5.5%, a difference of 0.84%), and Black/African American (5.5%, a difference of 1.0%).
| Demographics | Rating | Rank | Unemployment Among Ages 55 to 59 years |
| Immigrants | Dominica | 0.0 /100 | #301 | Tragic 5.5% |
| Sierra Leoneans | 0.0 /100 | #302 | Tragic 5.5% |
| Marshallese | 0.0 /100 | #303 | Tragic 5.5% |
| Blacks/African Americans | 0.0 /100 | #304 | Tragic 5.5% |
| Immigrants | Portugal | 0.0 /100 | #305 | Tragic 5.5% |
| Immigrants | Cabo Verde | 0.0 /100 | #306 | Tragic 5.5% |
| Immigrants | Belize | 0.0 /100 | #307 | Tragic 5.5% |
| Spanish American Indians | 0.0 /100 | #308 | Tragic 5.6% |
| Nepalese | 0.0 /100 | #309 | Tragic 5.6% |
| Belizeans | 0.0 /100 | #310 | Tragic 5.6% |
| Houma | 0.0 /100 | #311 | Tragic 5.6% |
| Ecuadorians | 0.0 /100 | #312 | Tragic 5.6% |
| Central American Indians | 0.0 /100 | #313 | Tragic 5.6% |
| Tlingit-Haida | 0.0 /100 | #314 | Tragic 5.7% |
| Guyanese | 0.0 /100 | #315 | Tragic 5.7% |