Alaska Native vs Spanish American Indian Unemployment Among Ages 25 to 29 years
COMPARE
Alaska Native
Spanish American Indian
Unemployment Among Ages 25 to 29 years
Unemployment Among Ages 25 to 29 years Comparison
Alaska Natives
Spanish American Indians
10.2%
UNEMPLOYMENT AMONG AGES 25 TO 29 YEARS
0.0/ 100
METRIC RATING
331st/ 347
METRIC RANK
7.1%
UNEMPLOYMENT AMONG AGES 25 TO 29 YEARS
1.1/ 100
METRIC RATING
242nd/ 347
METRIC RANK
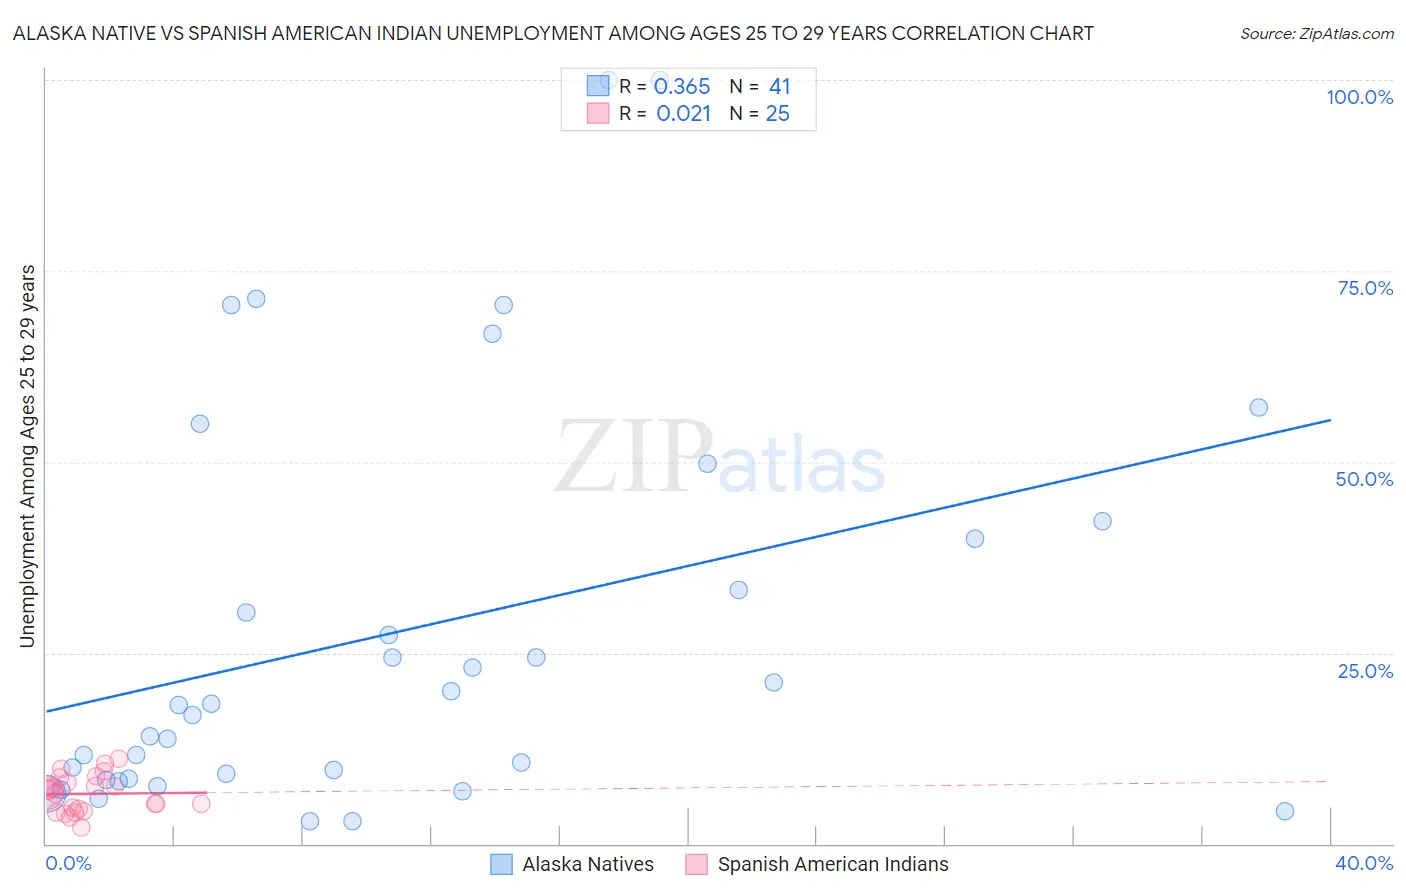
Alaska Native vs Spanish American Indian Unemployment Among Ages 25 to 29 years Correlation Chart
The statistical analysis conducted on geographies consisting of 75,796,081 people shows a mild positive correlation between the proportion of Alaska Natives and unemployment rate among population between the ages 25 and 29 in the United States with a correlation coefficient (R) of 0.365 and weighted average of 10.2%. Similarly, the statistical analysis conducted on geographies consisting of 72,626,200 people shows no correlation between the proportion of Spanish American Indians and unemployment rate among population between the ages 25 and 29 in the United States with a correlation coefficient (R) of 0.021 and weighted average of 7.1%, a difference of 43.4%.
Unemployment Among Ages 25 to 29 years Correlation Summary
| Measurement | Alaska Native | Spanish American Indian |
| Minimum | 2.9% | 2.2% |
| Maximum | 100.0% | 11.2% |
| Range | 97.1% | 9.0% |
| Mean | 27.8% | 6.5% |
| Median | 18.1% | 6.7% |
| Interquartile 25% (IQ1) | 8.4% | 4.5% |
| Interquartile 75% (IQ3) | 41.1% | 8.3% |
| Interquartile Range (IQR) | 32.7% | 3.9% |
| Standard Deviation (Sample) | 26.4% | 2.4% |
| Standard Deviation (Population) | 26.0% | 2.3% |
Similar Demographics by Unemployment Among Ages 25 to 29 years
Demographics Similar to Alaska Natives by Unemployment Among Ages 25 to 29 years
In terms of unemployment among ages 25 to 29 years, the demographic groups most similar to Alaska Natives are Pueblo (10.4%, a difference of 2.3%), Native/Alaskan (9.8%, a difference of 3.7%), Aleut (9.7%, a difference of 5.2%), Alaskan Athabascan (10.8%, a difference of 5.8%), and Apache (9.5%, a difference of 7.5%).
| Demographics | Rating | Rank | Unemployment Among Ages 25 to 29 years |
| Houma | 0.0 /100 | #324 | Tragic 8.7% |
| Yakama | 0.0 /100 | #325 | Tragic 8.8% |
| Shoshone | 0.0 /100 | #326 | Tragic 9.2% |
| Colville | 0.0 /100 | #327 | Tragic 9.2% |
| Apache | 0.0 /100 | #328 | Tragic 9.5% |
| Aleuts | 0.0 /100 | #329 | Tragic 9.7% |
| Natives/Alaskans | 0.0 /100 | #330 | Tragic 9.8% |
| Alaska Natives | 0.0 /100 | #331 | Tragic 10.2% |
| Pueblo | 0.0 /100 | #332 | Tragic 10.4% |
| Alaskan Athabascans | 0.0 /100 | #333 | Tragic 10.8% |
| Yuman | 0.0 /100 | #334 | Tragic 11.0% |
| Puerto Ricans | 0.0 /100 | #335 | Tragic 11.1% |
| Lumbee | 0.0 /100 | #336 | Tragic 11.2% |
| Menominee | 0.0 /100 | #337 | Tragic 11.3% |
| Sioux | 0.0 /100 | #338 | Tragic 11.7% |
Demographics Similar to Spanish American Indians by Unemployment Among Ages 25 to 29 years
In terms of unemployment among ages 25 to 29 years, the demographic groups most similar to Spanish American Indians are Yaqui (7.1%, a difference of 0.13%), Nonimmigrants (7.1%, a difference of 0.16%), Immigrants from Sierra Leone (7.1%, a difference of 0.26%), Guatemalan (7.1%, a difference of 0.26%), and Native Hawaiian (7.1%, a difference of 0.30%).
| Demographics | Rating | Rank | Unemployment Among Ages 25 to 29 years |
| Panamanians | 2.1 /100 | #235 | Tragic 7.0% |
| Cape Verdeans | 1.9 /100 | #236 | Tragic 7.0% |
| Puget Sound Salish | 1.8 /100 | #237 | Tragic 7.1% |
| Hondurans | 1.8 /100 | #238 | Tragic 7.1% |
| Potawatomi | 1.3 /100 | #239 | Tragic 7.1% |
| Native Hawaiians | 1.3 /100 | #240 | Tragic 7.1% |
| Immigrants | Sierra Leone | 1.3 /100 | #241 | Tragic 7.1% |
| Spanish American Indians | 1.1 /100 | #242 | Tragic 7.1% |
| Yaqui | 1.0 /100 | #243 | Tragic 7.1% |
| Immigrants | Nonimmigrants | 0.9 /100 | #244 | Tragic 7.1% |
| Guatemalans | 0.9 /100 | #245 | Tragic 7.1% |
| Immigrants | Uzbekistan | 0.7 /100 | #246 | Tragic 7.2% |
| Immigrants | Guatemala | 0.7 /100 | #247 | Tragic 7.2% |
| Sub-Saharan Africans | 0.6 /100 | #248 | Tragic 7.2% |
| Seminole | 0.6 /100 | #249 | Tragic 7.2% |