Alaska Native vs Korean Unemployment Among Ages 55 to 59 years
COMPARE
Alaska Native
Korean
Unemployment Among Ages 55 to 59 years
Unemployment Among Ages 55 to 59 years Comparison
Alaska Natives
Koreans
6.2%
UNEMPLOYMENT AMONG AGES 55 TO 59 YEARS
0.0/ 100
METRIC RATING
330th/ 347
METRIC RANK
4.8%
UNEMPLOYMENT AMONG AGES 55 TO 59 YEARS
64.6/ 100
METRIC RATING
161st/ 347
METRIC RANK
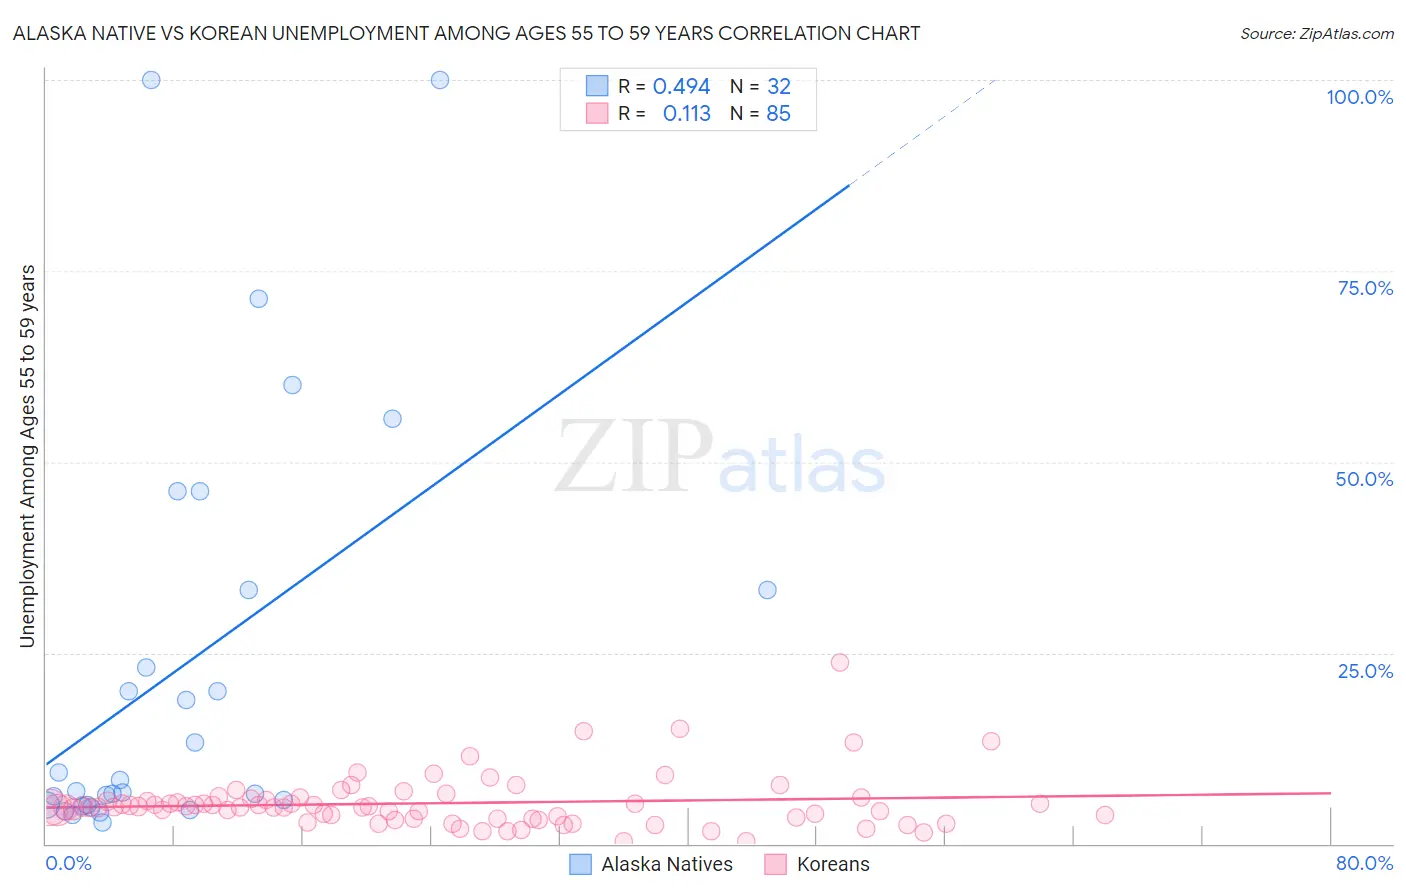
Alaska Native vs Korean Unemployment Among Ages 55 to 59 years Correlation Chart
The statistical analysis conducted on geographies consisting of 74,675,263 people shows a moderate positive correlation between the proportion of Alaska Natives and unemployment rate among population between the ages 55 and 59 in the United States with a correlation coefficient (R) of 0.494 and weighted average of 6.2%. Similarly, the statistical analysis conducted on geographies consisting of 457,300,893 people shows a poor positive correlation between the proportion of Koreans and unemployment rate among population between the ages 55 and 59 in the United States with a correlation coefficient (R) of 0.113 and weighted average of 4.8%, a difference of 30.4%.
Unemployment Among Ages 55 to 59 years Correlation Summary
| Measurement | Alaska Native | Korean |
| Minimum | 2.8% | 0.40% |
| Maximum | 100.0% | 23.7% |
| Range | 97.2% | 23.3% |
| Mean | 23.2% | 5.3% |
| Median | 7.6% | 4.8% |
| Interquartile 25% (IQ1) | 5.0% | 3.3% |
| Interquartile 75% (IQ3) | 33.3% | 5.7% |
| Interquartile Range (IQR) | 28.3% | 2.5% |
| Standard Deviation (Sample) | 27.5% | 3.5% |
| Standard Deviation (Population) | 27.1% | 3.5% |
Similar Demographics by Unemployment Among Ages 55 to 59 years
Demographics Similar to Alaska Natives by Unemployment Among Ages 55 to 59 years
In terms of unemployment among ages 55 to 59 years, the demographic groups most similar to Alaska Natives are Dominican (6.2%, a difference of 0.43%), Immigrants from Dominican Republic (6.3%, a difference of 0.68%), Yuman (6.1%, a difference of 1.9%), Arapaho (6.1%, a difference of 3.1%), and Aleut (6.4%, a difference of 3.1%).
| Demographics | Rating | Rank | Unemployment Among Ages 55 to 59 years |
| Immigrants | Bangladesh | 0.0 /100 | #323 | Tragic 5.9% |
| Vietnamese | 0.0 /100 | #324 | Tragic 5.9% |
| Immigrants | Armenia | 0.0 /100 | #325 | Tragic 6.0% |
| Natives/Alaskans | 0.0 /100 | #326 | Tragic 6.0% |
| Arapaho | 0.0 /100 | #327 | Tragic 6.1% |
| Yuman | 0.0 /100 | #328 | Tragic 6.1% |
| Dominicans | 0.0 /100 | #329 | Tragic 6.2% |
| Alaska Natives | 0.0 /100 | #330 | Tragic 6.2% |
| Immigrants | Dominican Republic | 0.0 /100 | #331 | Tragic 6.3% |
| Aleuts | 0.0 /100 | #332 | Tragic 6.4% |
| Pima | 0.0 /100 | #333 | Tragic 6.6% |
| Pueblo | 0.0 /100 | #334 | Tragic 6.7% |
| Colville | 0.0 /100 | #335 | Tragic 6.7% |
| Navajo | 0.0 /100 | #336 | Tragic 6.7% |
| Paiute | 0.0 /100 | #337 | Tragic 6.8% |
Demographics Similar to Koreans by Unemployment Among Ages 55 to 59 years
In terms of unemployment among ages 55 to 59 years, the demographic groups most similar to Koreans are Chickasaw (4.8%, a difference of 0.020%), Immigrants from Africa (4.8%, a difference of 0.020%), Slovak (4.8%, a difference of 0.030%), Immigrants from Nicaragua (4.8%, a difference of 0.030%), and Immigrants from Lebanon (4.8%, a difference of 0.030%).
| Demographics | Rating | Rank | Unemployment Among Ages 55 to 59 years |
| Immigrants | Panama | 66.8 /100 | #154 | Good 4.8% |
| Immigrants | North Macedonia | 66.3 /100 | #155 | Good 4.8% |
| Italians | 66.2 /100 | #156 | Good 4.8% |
| Carpatho Rusyns | 66.0 /100 | #157 | Good 4.8% |
| Slovaks | 65.3 /100 | #158 | Good 4.8% |
| Immigrants | Nicaragua | 65.2 /100 | #159 | Good 4.8% |
| Chickasaw | 65.1 /100 | #160 | Good 4.8% |
| Koreans | 64.6 /100 | #161 | Good 4.8% |
| Immigrants | Africa | 64.2 /100 | #162 | Good 4.8% |
| Immigrants | Lebanon | 63.8 /100 | #163 | Good 4.8% |
| Americans | 63.3 /100 | #164 | Good 4.8% |
| Immigrants | France | 62.0 /100 | #165 | Good 4.8% |
| Potawatomi | 62.0 /100 | #166 | Good 4.8% |
| Immigrants | Western Europe | 60.4 /100 | #167 | Good 4.8% |
| Immigrants | Cambodia | 59.3 /100 | #168 | Average 4.8% |