Alaska Native vs West Indian Unemployment Among Ages 55 to 59 years
COMPARE
Alaska Native
West Indian
Unemployment Among Ages 55 to 59 years
Unemployment Among Ages 55 to 59 years Comparison
Alaska Natives
West Indians
6.2%
UNEMPLOYMENT AMONG AGES 55 TO 59 YEARS
0.0/ 100
METRIC RATING
330th/ 347
METRIC RANK
5.2%
UNEMPLOYMENT AMONG AGES 55 TO 59 YEARS
0.0/ 100
METRIC RATING
276th/ 347
METRIC RANK
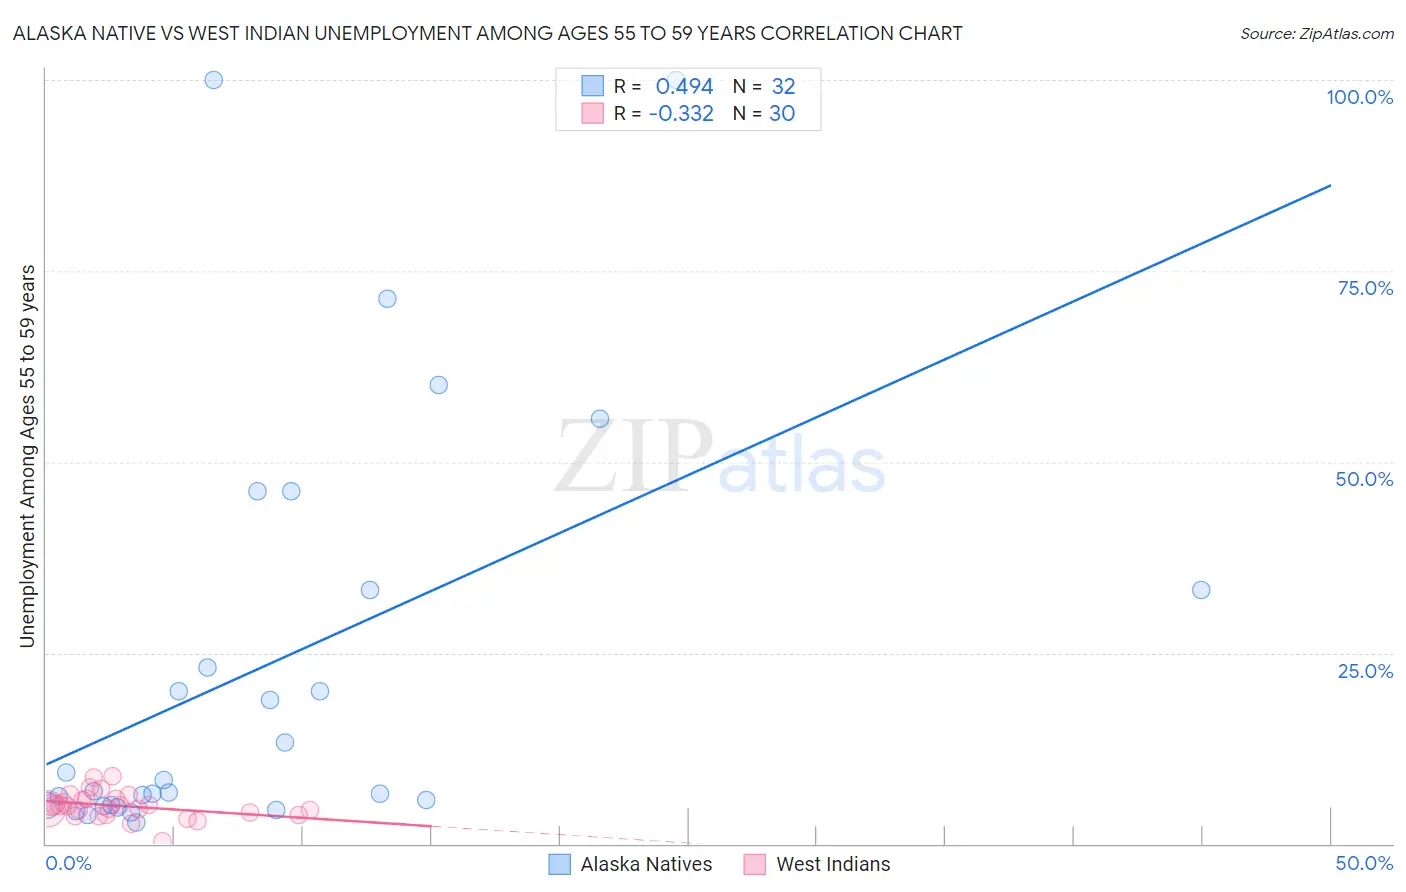
Alaska Native vs West Indian Unemployment Among Ages 55 to 59 years Correlation Chart
The statistical analysis conducted on geographies consisting of 74,675,263 people shows a moderate positive correlation between the proportion of Alaska Natives and unemployment rate among population between the ages 55 and 59 in the United States with a correlation coefficient (R) of 0.494 and weighted average of 6.2%. Similarly, the statistical analysis conducted on geographies consisting of 243,325,614 people shows a mild negative correlation between the proportion of West Indians and unemployment rate among population between the ages 55 and 59 in the United States with a correlation coefficient (R) of -0.332 and weighted average of 5.2%, a difference of 19.6%.
Unemployment Among Ages 55 to 59 years Correlation Summary
| Measurement | Alaska Native | West Indian |
| Minimum | 2.8% | 0.40% |
| Maximum | 100.0% | 8.8% |
| Range | 97.2% | 8.4% |
| Mean | 23.2% | 4.9% |
| Median | 7.6% | 4.9% |
| Interquartile 25% (IQ1) | 5.0% | 3.8% |
| Interquartile 75% (IQ3) | 33.3% | 5.9% |
| Interquartile Range (IQR) | 28.3% | 2.1% |
| Standard Deviation (Sample) | 27.5% | 1.8% |
| Standard Deviation (Population) | 27.1% | 1.7% |
Similar Demographics by Unemployment Among Ages 55 to 59 years
Demographics Similar to Alaska Natives by Unemployment Among Ages 55 to 59 years
In terms of unemployment among ages 55 to 59 years, the demographic groups most similar to Alaska Natives are Dominican (6.2%, a difference of 0.43%), Immigrants from Dominican Republic (6.3%, a difference of 0.68%), Yuman (6.1%, a difference of 1.9%), Arapaho (6.1%, a difference of 3.1%), and Aleut (6.4%, a difference of 3.1%).
| Demographics | Rating | Rank | Unemployment Among Ages 55 to 59 years |
| Immigrants | Bangladesh | 0.0 /100 | #323 | Tragic 5.9% |
| Vietnamese | 0.0 /100 | #324 | Tragic 5.9% |
| Immigrants | Armenia | 0.0 /100 | #325 | Tragic 6.0% |
| Natives/Alaskans | 0.0 /100 | #326 | Tragic 6.0% |
| Arapaho | 0.0 /100 | #327 | Tragic 6.1% |
| Yuman | 0.0 /100 | #328 | Tragic 6.1% |
| Dominicans | 0.0 /100 | #329 | Tragic 6.2% |
| Alaska Natives | 0.0 /100 | #330 | Tragic 6.2% |
| Immigrants | Dominican Republic | 0.0 /100 | #331 | Tragic 6.3% |
| Aleuts | 0.0 /100 | #332 | Tragic 6.4% |
| Pima | 0.0 /100 | #333 | Tragic 6.6% |
| Pueblo | 0.0 /100 | #334 | Tragic 6.7% |
| Colville | 0.0 /100 | #335 | Tragic 6.7% |
| Navajo | 0.0 /100 | #336 | Tragic 6.7% |
| Paiute | 0.0 /100 | #337 | Tragic 6.8% |
Demographics Similar to West Indians by Unemployment Among Ages 55 to 59 years
In terms of unemployment among ages 55 to 59 years, the demographic groups most similar to West Indians are Israeli (5.2%, a difference of 0.010%), Mexican American Indian (5.2%, a difference of 0.11%), Immigrants from Latin America (5.2%, a difference of 0.12%), Ottawa (5.2%, a difference of 0.23%), and Immigrants from Barbados (5.2%, a difference of 0.30%).
| Demographics | Rating | Rank | Unemployment Among Ages 55 to 59 years |
| Tsimshian | 0.1 /100 | #269 | Tragic 5.2% |
| Ute | 0.1 /100 | #270 | Tragic 5.2% |
| Cree | 0.1 /100 | #271 | Tragic 5.2% |
| Immigrants | Jamaica | 0.0 /100 | #272 | Tragic 5.2% |
| Ottawa | 0.0 /100 | #273 | Tragic 5.2% |
| Mexican American Indians | 0.0 /100 | #274 | Tragic 5.2% |
| Israelis | 0.0 /100 | #275 | Tragic 5.2% |
| West Indians | 0.0 /100 | #276 | Tragic 5.2% |
| Immigrants | Latin America | 0.0 /100 | #277 | Tragic 5.2% |
| Immigrants | Barbados | 0.0 /100 | #278 | Tragic 5.2% |
| Alsatians | 0.0 /100 | #279 | Tragic 5.2% |
| Immigrants | Uzbekistan | 0.0 /100 | #280 | Tragic 5.3% |
| Guatemalans | 0.0 /100 | #281 | Tragic 5.3% |
| Immigrants | Trinidad and Tobago | 0.0 /100 | #282 | Tragic 5.3% |
| Apache | 0.0 /100 | #283 | Tragic 5.3% |