Yuman vs Spanish American Indian Unemployment Among Ages 55 to 59 years
COMPARE
Yuman
Spanish American Indian
Unemployment Among Ages 55 to 59 years
Unemployment Among Ages 55 to 59 years Comparison
Yuman
Spanish American Indians
6.1%
UNEMPLOYMENT AMONG AGES 55 TO 59 YEARS
0.0/ 100
METRIC RATING
328th/ 347
METRIC RANK
5.6%
UNEMPLOYMENT AMONG AGES 55 TO 59 YEARS
0.0/ 100
METRIC RATING
308th/ 347
METRIC RANK
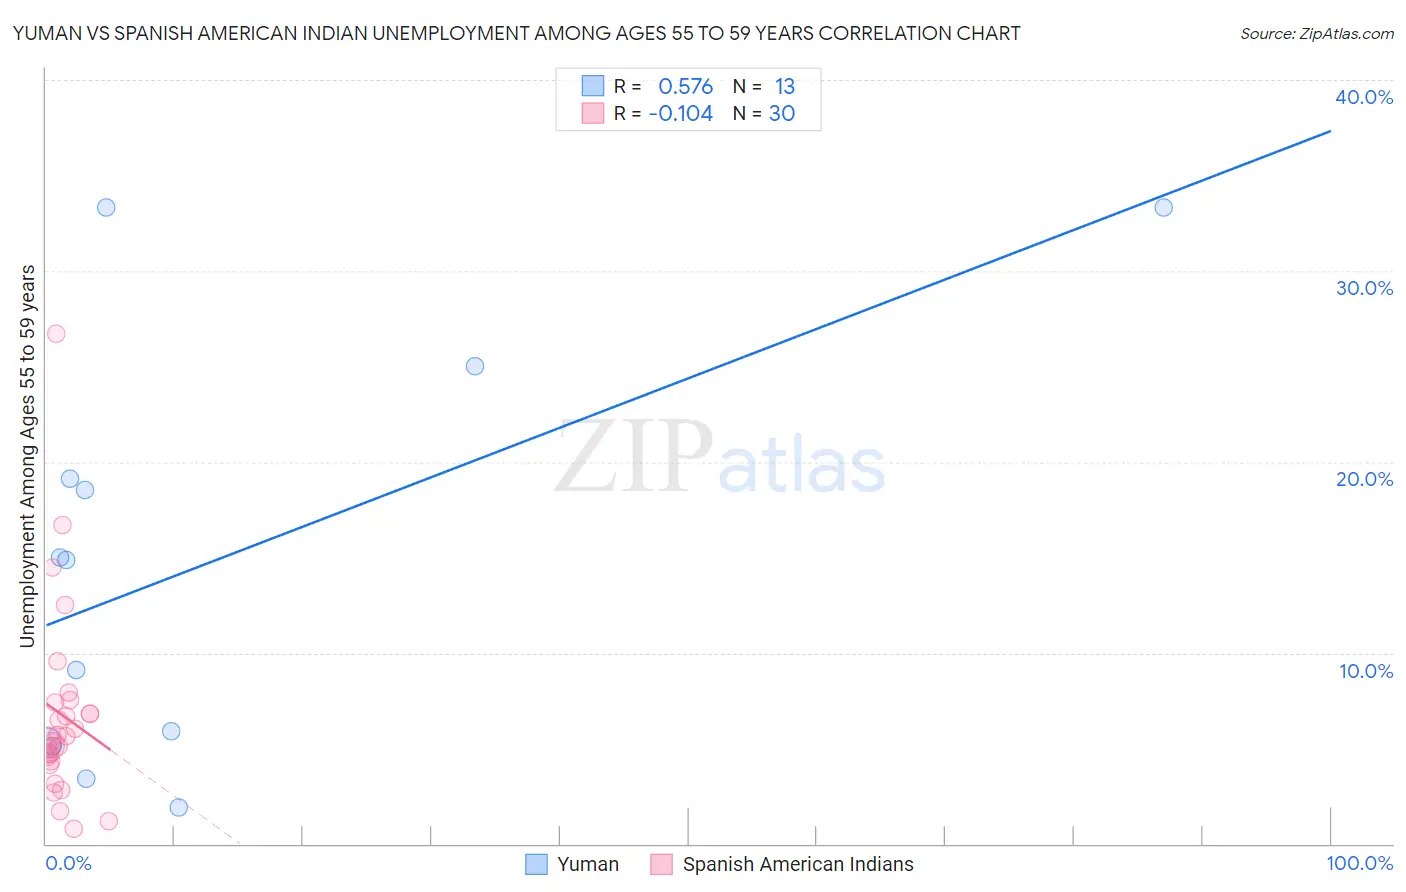
Yuman vs Spanish American Indian Unemployment Among Ages 55 to 59 years Correlation Chart
The statistical analysis conducted on geographies consisting of 40,038,112 people shows a substantial positive correlation between the proportion of Yuman and unemployment rate among population between the ages 55 and 59 in the United States with a correlation coefficient (R) of 0.576 and weighted average of 6.1%. Similarly, the statistical analysis conducted on geographies consisting of 72,280,183 people shows a poor negative correlation between the proportion of Spanish American Indians and unemployment rate among population between the ages 55 and 59 in the United States with a correlation coefficient (R) of -0.104 and weighted average of 5.6%, a difference of 10.3%.
Unemployment Among Ages 55 to 59 years Correlation Summary
| Measurement | Yuman | Spanish American Indian |
| Minimum | 1.9% | 0.80% |
| Maximum | 33.3% | 26.7% |
| Range | 31.4% | 25.9% |
| Mean | 14.6% | 6.8% |
| Median | 14.8% | 5.5% |
| Interquartile 25% (IQ1) | 5.2% | 4.4% |
| Interquartile 75% (IQ3) | 22.1% | 7.4% |
| Interquartile Range (IQR) | 16.9% | 3.0% |
| Standard Deviation (Sample) | 10.9% | 5.2% |
| Standard Deviation (Population) | 10.4% | 5.1% |
Demographics Similar to Yuman and Spanish American Indians by Unemployment Among Ages 55 to 59 years
In terms of unemployment among ages 55 to 59 years, the demographic groups most similar to Yuman are Arapaho (6.1%, a difference of 1.2%), Native/Alaskan (6.0%, a difference of 2.1%), Immigrants from Armenia (6.0%, a difference of 2.5%), Vietnamese (5.9%, a difference of 4.3%), and Immigrants from Bangladesh (5.9%, a difference of 4.3%). Similarly, the demographic groups most similar to Spanish American Indians are Nepalese (5.6%, a difference of 0.58%), Belizean (5.6%, a difference of 1.0%), Houma (5.6%, a difference of 1.2%), Ecuadorian (5.6%, a difference of 1.4%), and Central American Indian (5.6%, a difference of 1.6%).
| Demographics | Rating | Rank | Unemployment Among Ages 55 to 59 years |
| Spanish American Indians | 0.0 /100 | #308 | Tragic 5.6% |
| Nepalese | 0.0 /100 | #309 | Tragic 5.6% |
| Belizeans | 0.0 /100 | #310 | Tragic 5.6% |
| Houma | 0.0 /100 | #311 | Tragic 5.6% |
| Ecuadorians | 0.0 /100 | #312 | Tragic 5.6% |
| Central American Indians | 0.0 /100 | #313 | Tragic 5.6% |
| Tlingit-Haida | 0.0 /100 | #314 | Tragic 5.7% |
| Guyanese | 0.0 /100 | #315 | Tragic 5.7% |
| Immigrants | Ecuador | 0.0 /100 | #316 | Tragic 5.7% |
| Hmong | 0.0 /100 | #317 | Tragic 5.7% |
| Immigrants | Guyana | 0.0 /100 | #318 | Tragic 5.8% |
| Kiowa | 0.0 /100 | #319 | Tragic 5.8% |
| Immigrants | Azores | 0.0 /100 | #320 | Tragic 5.8% |
| Chippewa | 0.0 /100 | #321 | Tragic 5.9% |
| Crow | 0.0 /100 | #322 | Tragic 5.9% |
| Immigrants | Bangladesh | 0.0 /100 | #323 | Tragic 5.9% |
| Vietnamese | 0.0 /100 | #324 | Tragic 5.9% |
| Immigrants | Armenia | 0.0 /100 | #325 | Tragic 6.0% |
| Natives/Alaskans | 0.0 /100 | #326 | Tragic 6.0% |
| Arapaho | 0.0 /100 | #327 | Tragic 6.1% |
| Yuman | 0.0 /100 | #328 | Tragic 6.1% |