Ottawa vs South American Unemployment
COMPARE
Ottawa
South American
Unemployment
Unemployment Comparison
Ottawa
South Americans
5.5%
UNEMPLOYMENT
5.4/ 100
METRIC RATING
230th/ 347
METRIC RANK
5.3%
UNEMPLOYMENT
33.9/ 100
METRIC RATING
192nd/ 347
METRIC RANK
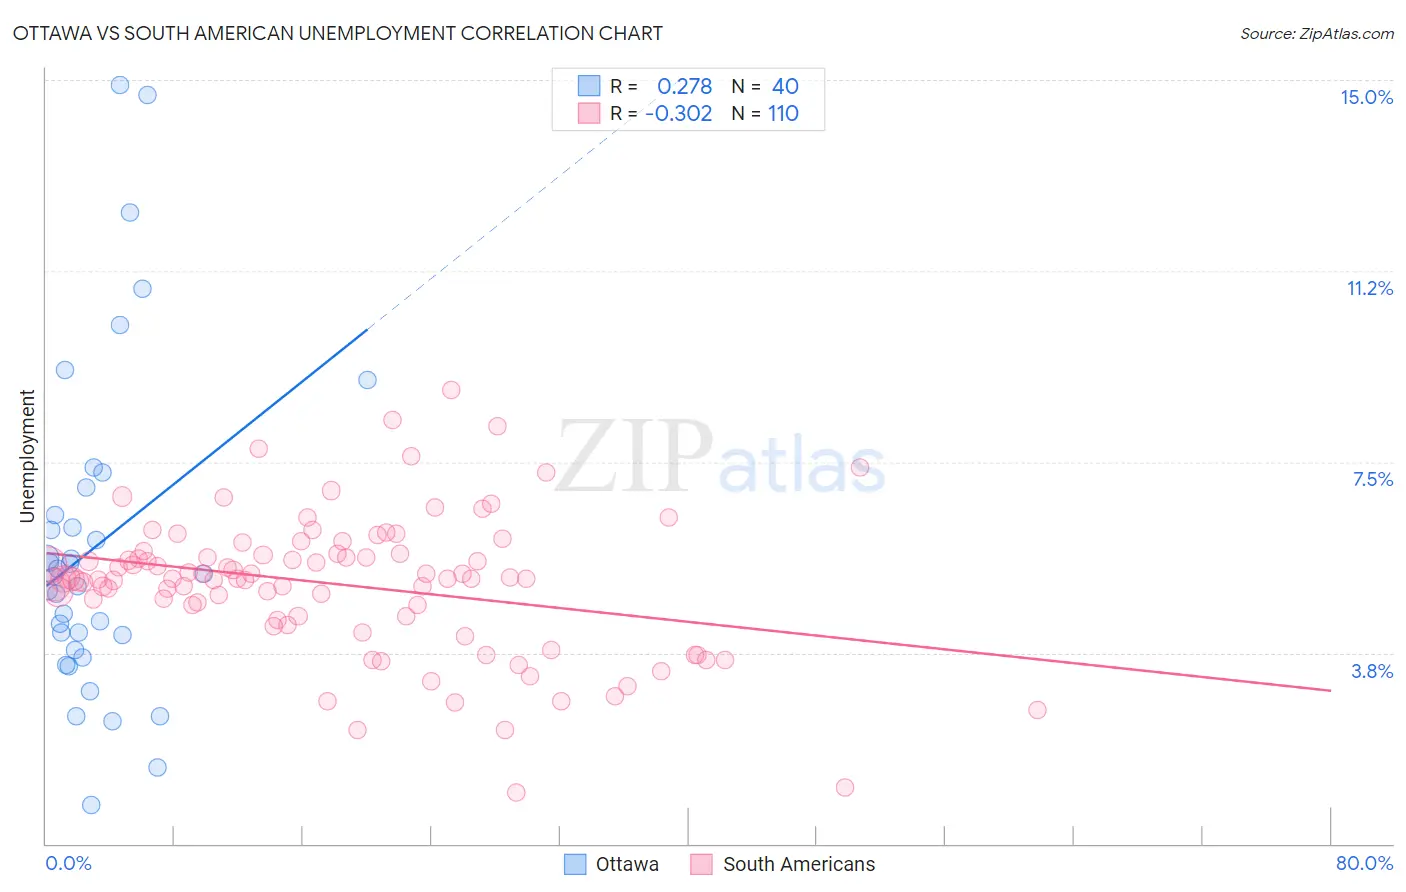
Ottawa vs South American Unemployment Correlation Chart
The statistical analysis conducted on geographies consisting of 49,942,125 people shows a weak positive correlation between the proportion of Ottawa and unemployment in the United States with a correlation coefficient (R) of 0.278 and weighted average of 5.5%. Similarly, the statistical analysis conducted on geographies consisting of 493,239,176 people shows a mild negative correlation between the proportion of South Americans and unemployment in the United States with a correlation coefficient (R) of -0.302 and weighted average of 5.3%, a difference of 3.4%.
Unemployment Correlation Summary
| Measurement | Ottawa | South American |
| Minimum | 0.77% | 1.0% |
| Maximum | 14.9% | 8.9% |
| Range | 14.1% | 7.9% |
| Mean | 5.8% | 5.1% |
| Median | 5.3% | 5.2% |
| Interquartile 25% (IQ1) | 4.0% | 4.5% |
| Interquartile 75% (IQ3) | 6.7% | 5.7% |
| Interquartile Range (IQR) | 2.8% | 1.2% |
| Standard Deviation (Sample) | 3.2% | 1.4% |
| Standard Deviation (Population) | 3.2% | 1.4% |
Similar Demographics by Unemployment
Demographics Similar to Ottawa by Unemployment
In terms of unemployment, the demographic groups most similar to Ottawa are Hawaiian (5.5%, a difference of 0.0%), Immigrants from Africa (5.5%, a difference of 0.13%), Comanche (5.5%, a difference of 0.13%), Immigrants from Syria (5.5%, a difference of 0.18%), and Panamanian (5.5%, a difference of 0.21%).
| Demographics | Rating | Rank | Unemployment |
| Seminole | 9.2 /100 | #223 | Tragic 5.4% |
| Israelis | 8.8 /100 | #224 | Tragic 5.4% |
| South American Indians | 7.8 /100 | #225 | Tragic 5.5% |
| Samoans | 7.1 /100 | #226 | Tragic 5.5% |
| Immigrants | Lebanon | 7.0 /100 | #227 | Tragic 5.5% |
| Guamanians/Chamorros | 6.3 /100 | #228 | Tragic 5.5% |
| Hawaiians | 5.4 /100 | #229 | Tragic 5.5% |
| Ottawa | 5.4 /100 | #230 | Tragic 5.5% |
| Immigrants | Africa | 4.9 /100 | #231 | Tragic 5.5% |
| Comanche | 4.9 /100 | #232 | Tragic 5.5% |
| Immigrants | Syria | 4.8 /100 | #233 | Tragic 5.5% |
| Panamanians | 4.7 /100 | #234 | Tragic 5.5% |
| Immigrants | Panama | 3.4 /100 | #235 | Tragic 5.5% |
| Immigrants | Cambodia | 3.3 /100 | #236 | Tragic 5.5% |
| Moroccans | 3.2 /100 | #237 | Tragic 5.5% |
Demographics Similar to South Americans by Unemployment
In terms of unemployment, the demographic groups most similar to South Americans are Somali (5.3%, a difference of 0.0%), Immigrants from Somalia (5.3%, a difference of 0.010%), Arab (5.3%, a difference of 0.090%), Immigrants from Belarus (5.3%, a difference of 0.11%), and Alsatian (5.3%, a difference of 0.21%).
| Demographics | Rating | Rank | Unemployment |
| Immigrants | Thailand | 38.9 /100 | #185 | Fair 5.3% |
| Immigrants | Uganda | 37.8 /100 | #186 | Fair 5.3% |
| Costa Ricans | 37.4 /100 | #187 | Fair 5.3% |
| Alsatians | 37.0 /100 | #188 | Fair 5.3% |
| Immigrants | Belarus | 35.6 /100 | #189 | Fair 5.3% |
| Arabs | 35.3 /100 | #190 | Fair 5.3% |
| Somalis | 34.0 /100 | #191 | Fair 5.3% |
| South Americans | 33.9 /100 | #192 | Fair 5.3% |
| Immigrants | Somalia | 33.8 /100 | #193 | Fair 5.3% |
| Immigrants | Laos | 30.9 /100 | #194 | Fair 5.3% |
| Immigrants | Southern Europe | 30.9 /100 | #195 | Fair 5.3% |
| Peruvians | 29.9 /100 | #196 | Fair 5.3% |
| Immigrants | Uruguay | 29.8 /100 | #197 | Fair 5.3% |
| Immigrants | Israel | 28.6 /100 | #198 | Fair 5.3% |
| Immigrants | Afghanistan | 28.6 /100 | #199 | Fair 5.3% |