Tongan vs Immigrants from Micronesia Unemployment Among Ages 25 to 29 years
COMPARE
Tongan
Immigrants from Micronesia
Unemployment Among Ages 25 to 29 years
Unemployment Among Ages 25 to 29 years Comparison
Tongans
Immigrants from Micronesia
5.5%
UNEMPLOYMENT AMONG AGES 25 TO 29 YEARS
100.0/ 100
METRIC RATING
2nd/ 347
METRIC RANK
6.6%
UNEMPLOYMENT AMONG AGES 25 TO 29 YEARS
71.5/ 100
METRIC RATING
144th/ 347
METRIC RANK
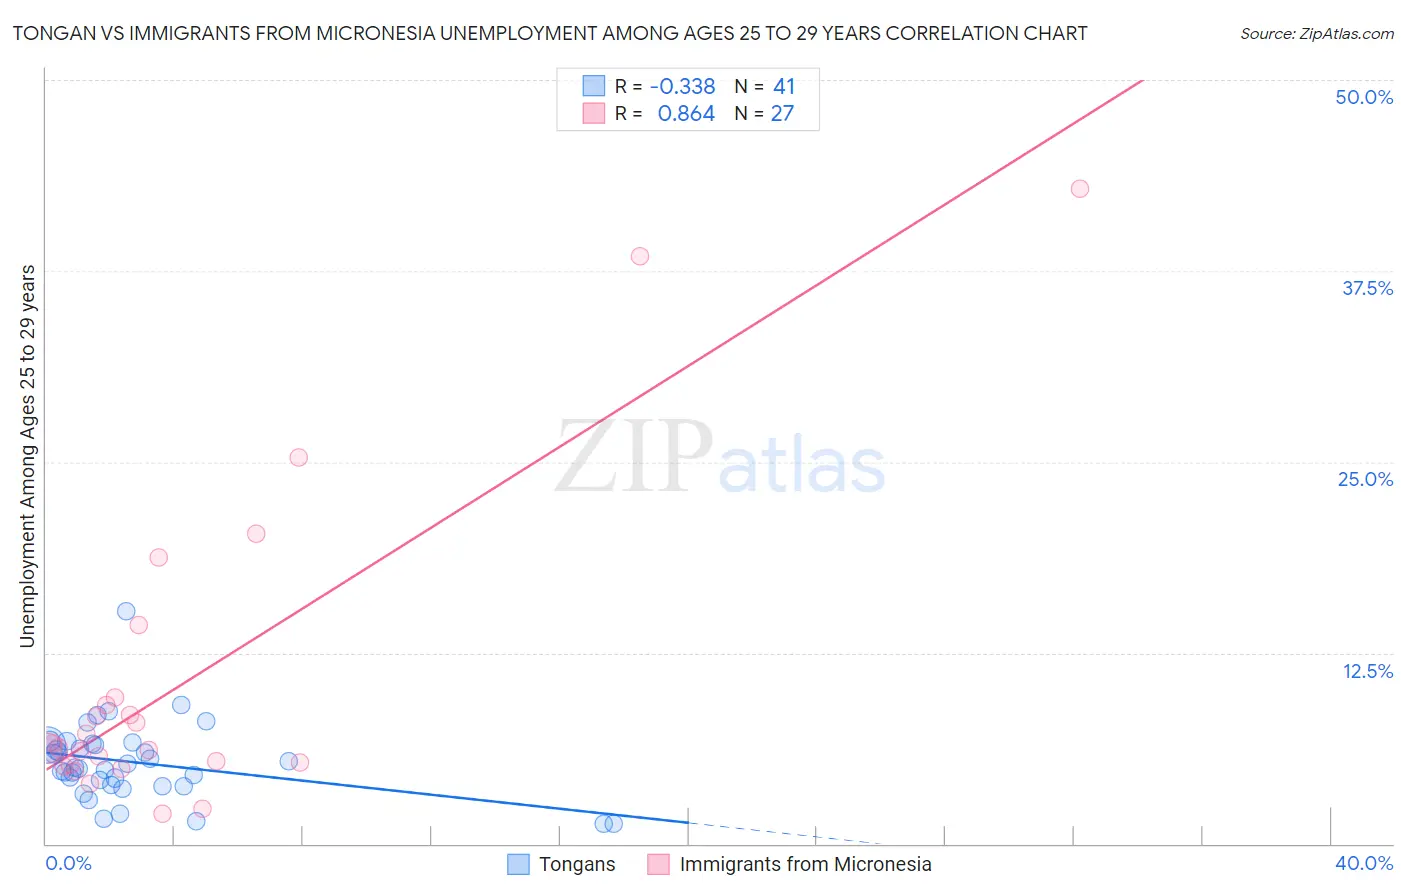
Tongan vs Immigrants from Micronesia Unemployment Among Ages 25 to 29 years Correlation Chart
The statistical analysis conducted on geographies consisting of 101,173,366 people shows a mild negative correlation between the proportion of Tongans and unemployment rate among population between the ages 25 and 29 in the United States with a correlation coefficient (R) of -0.338 and weighted average of 5.5%. Similarly, the statistical analysis conducted on geographies consisting of 61,003,486 people shows a very strong positive correlation between the proportion of Immigrants from Micronesia and unemployment rate among population between the ages 25 and 29 in the United States with a correlation coefficient (R) of 0.864 and weighted average of 6.6%, a difference of 18.8%.
Unemployment Among Ages 25 to 29 years Correlation Summary
| Measurement | Tongan | Immigrants from Micronesia |
| Minimum | 1.3% | 2.0% |
| Maximum | 15.2% | 42.9% |
| Range | 13.9% | 40.9% |
| Mean | 5.3% | 10.6% |
| Median | 5.0% | 6.3% |
| Interquartile 25% (IQ1) | 3.8% | 5.2% |
| Interquartile 75% (IQ3) | 6.5% | 9.6% |
| Interquartile Range (IQR) | 2.7% | 4.4% |
| Standard Deviation (Sample) | 2.5% | 10.2% |
| Standard Deviation (Population) | 2.5% | 10.1% |
Similar Demographics by Unemployment Among Ages 25 to 29 years
Demographics Similar to Tongans by Unemployment Among Ages 25 to 29 years
In terms of unemployment among ages 25 to 29 years, the demographic groups most similar to Tongans are Immigrants from Somalia (5.5%, a difference of 0.31%), Immigrants from Cuba (5.6%, a difference of 2.4%), Somali (5.6%, a difference of 2.4%), Sudanese (5.4%, a difference of 2.5%), and Hmong (5.7%, a difference of 2.6%).
| Demographics | Rating | Rank | Unemployment Among Ages 25 to 29 years |
| Sudanese | 100.0 /100 | #1 | Exceptional 5.4% |
| Tongans | 100.0 /100 | #2 | Exceptional 5.5% |
| Immigrants | Somalia | 100.0 /100 | #3 | Exceptional 5.5% |
| Immigrants | Cuba | 100.0 /100 | #4 | Exceptional 5.6% |
| Somalis | 100.0 /100 | #5 | Exceptional 5.6% |
| Hmong | 100.0 /100 | #6 | Exceptional 5.7% |
| Immigrants | India | 100.0 /100 | #7 | Exceptional 5.7% |
| Immigrants | Bosnia and Herzegovina | 100.0 /100 | #8 | Exceptional 5.7% |
| Immigrants | Nepal | 100.0 /100 | #9 | Exceptional 5.7% |
| Immigrants | Sudan | 100.0 /100 | #10 | Exceptional 5.8% |
| Cambodians | 100.0 /100 | #11 | Exceptional 5.8% |
| Okinawans | 100.0 /100 | #12 | Exceptional 5.9% |
| Immigrants | Bolivia | 100.0 /100 | #13 | Exceptional 5.9% |
| Immigrants | Kuwait | 99.9 /100 | #14 | Exceptional 5.9% |
| Cubans | 99.9 /100 | #15 | Exceptional 5.9% |
Demographics Similar to Immigrants from Micronesia by Unemployment Among Ages 25 to 29 years
In terms of unemployment among ages 25 to 29 years, the demographic groups most similar to Immigrants from Micronesia are Lithuanian (6.5%, a difference of 0.050%), Slavic (6.5%, a difference of 0.080%), Nicaraguan (6.6%, a difference of 0.10%), Maltese (6.5%, a difference of 0.11%), and Romanian (6.6%, a difference of 0.16%).
| Demographics | Rating | Rank | Unemployment Among Ages 25 to 29 years |
| Eastern Europeans | 74.1 /100 | #137 | Good 6.5% |
| Immigrants | Belgium | 73.8 /100 | #138 | Good 6.5% |
| Austrians | 73.8 /100 | #139 | Good 6.5% |
| Immigrants | Pakistan | 73.8 /100 | #140 | Good 6.5% |
| Maltese | 72.9 /100 | #141 | Good 6.5% |
| Slavs | 72.5 /100 | #142 | Good 6.5% |
| Lithuanians | 72.2 /100 | #143 | Good 6.5% |
| Immigrants | Micronesia | 71.5 /100 | #144 | Good 6.6% |
| Nicaraguans | 70.2 /100 | #145 | Good 6.6% |
| Romanians | 69.5 /100 | #146 | Good 6.6% |
| Immigrants | Thailand | 68.4 /100 | #147 | Good 6.6% |
| Peruvians | 68.1 /100 | #148 | Good 6.6% |
| Malaysians | 67.1 /100 | #149 | Good 6.6% |
| Finns | 66.9 /100 | #150 | Good 6.6% |
| Ukrainians | 65.5 /100 | #151 | Good 6.6% |