Latvian vs Immigrants from Micronesia Unemployment Among Ages 25 to 29 years
COMPARE
Latvian
Immigrants from Micronesia
Unemployment Among Ages 25 to 29 years
Unemployment Among Ages 25 to 29 years Comparison
Latvians
Immigrants from Micronesia
6.2%
UNEMPLOYMENT AMONG AGES 25 TO 29 YEARS
99.0/ 100
METRIC RATING
47th/ 347
METRIC RANK
6.6%
UNEMPLOYMENT AMONG AGES 25 TO 29 YEARS
71.5/ 100
METRIC RATING
144th/ 347
METRIC RANK
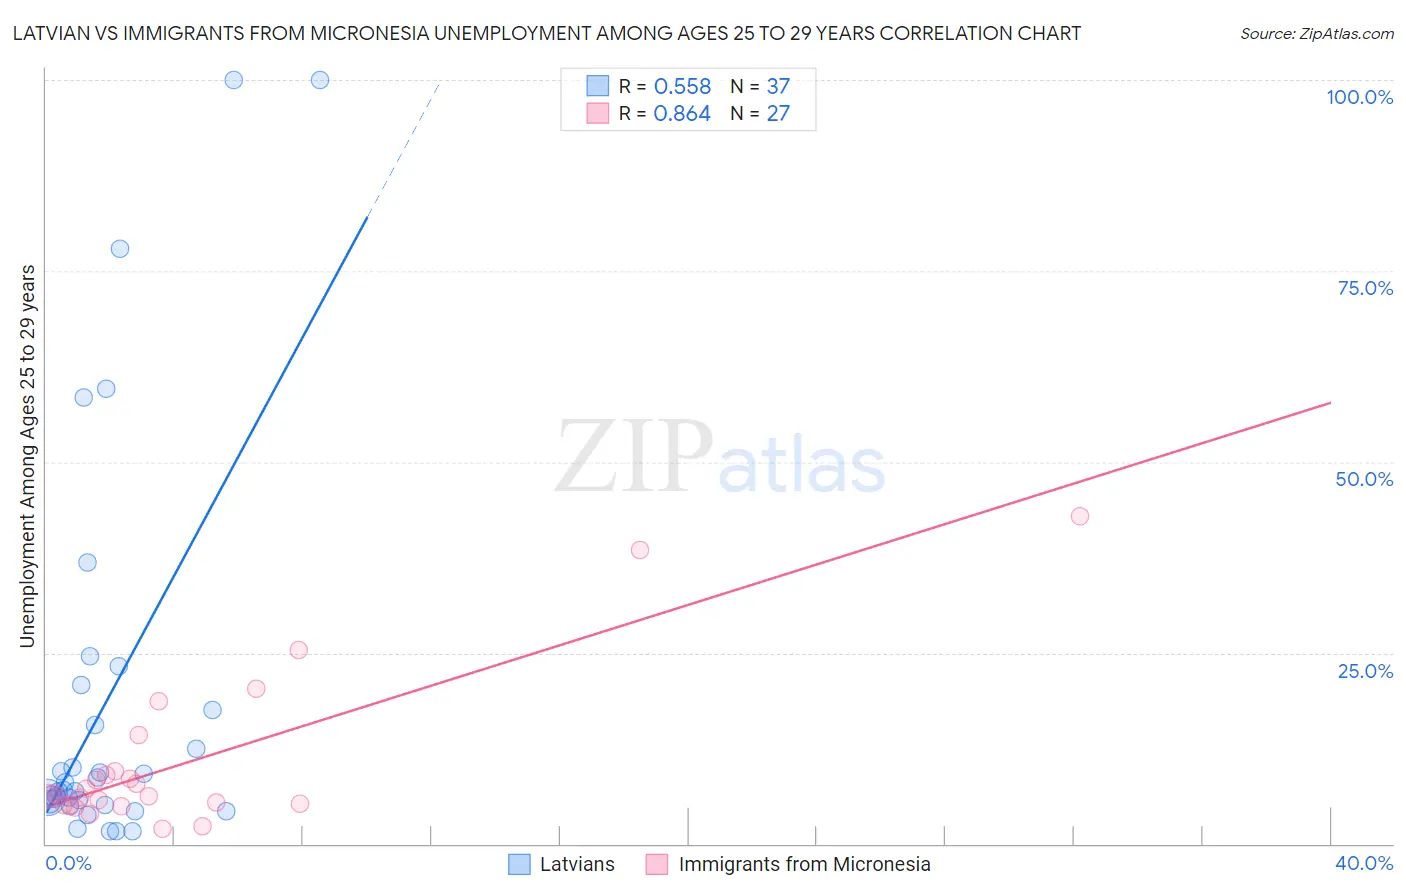
Latvian vs Immigrants from Micronesia Unemployment Among Ages 25 to 29 years Correlation Chart
The statistical analysis conducted on geographies consisting of 212,765,970 people shows a substantial positive correlation between the proportion of Latvians and unemployment rate among population between the ages 25 and 29 in the United States with a correlation coefficient (R) of 0.558 and weighted average of 6.2%. Similarly, the statistical analysis conducted on geographies consisting of 61,003,486 people shows a very strong positive correlation between the proportion of Immigrants from Micronesia and unemployment rate among population between the ages 25 and 29 in the United States with a correlation coefficient (R) of 0.864 and weighted average of 6.6%, a difference of 6.1%.
Unemployment Among Ages 25 to 29 years Correlation Summary
| Measurement | Latvian | Immigrants from Micronesia |
| Minimum | 1.6% | 2.0% |
| Maximum | 100.0% | 42.9% |
| Range | 98.4% | 40.9% |
| Mean | 18.7% | 10.6% |
| Median | 7.0% | 6.3% |
| Interquartile 25% (IQ1) | 5.3% | 5.2% |
| Interquartile 75% (IQ3) | 19.1% | 9.6% |
| Interquartile Range (IQR) | 13.8% | 4.4% |
| Standard Deviation (Sample) | 26.2% | 10.2% |
| Standard Deviation (Population) | 25.8% | 10.1% |
Similar Demographics by Unemployment Among Ages 25 to 29 years
Demographics Similar to Latvians by Unemployment Among Ages 25 to 29 years
In terms of unemployment among ages 25 to 29 years, the demographic groups most similar to Latvians are Immigrants from Australia (6.2%, a difference of 0.010%), Immigrants from Lithuania (6.2%, a difference of 0.020%), German Russian (6.2%, a difference of 0.080%), Venezuelan (6.2%, a difference of 0.10%), and Soviet Union (6.2%, a difference of 0.14%).
| Demographics | Rating | Rank | Unemployment Among Ages 25 to 29 years |
| Immigrants | Kenya | 99.3 /100 | #40 | Exceptional 6.1% |
| Fijians | 99.3 /100 | #41 | Exceptional 6.1% |
| Jordanians | 99.3 /100 | #42 | Exceptional 6.1% |
| Czechs | 99.2 /100 | #43 | Exceptional 6.2% |
| Mongolians | 99.2 /100 | #44 | Exceptional 6.2% |
| Venezuelans | 99.1 /100 | #45 | Exceptional 6.2% |
| Immigrants | Lithuania | 99.0 /100 | #46 | Exceptional 6.2% |
| Latvians | 99.0 /100 | #47 | Exceptional 6.2% |
| Immigrants | Australia | 99.0 /100 | #48 | Exceptional 6.2% |
| German Russians | 99.0 /100 | #49 | Exceptional 6.2% |
| Soviet Union | 98.9 /100 | #50 | Exceptional 6.2% |
| Burmese | 98.9 /100 | #51 | Exceptional 6.2% |
| Immigrants | Turkey | 98.9 /100 | #52 | Exceptional 6.2% |
| Turks | 98.8 /100 | #53 | Exceptional 6.2% |
| Swedes | 98.8 /100 | #54 | Exceptional 6.2% |
Demographics Similar to Immigrants from Micronesia by Unemployment Among Ages 25 to 29 years
In terms of unemployment among ages 25 to 29 years, the demographic groups most similar to Immigrants from Micronesia are Lithuanian (6.5%, a difference of 0.050%), Slavic (6.5%, a difference of 0.080%), Nicaraguan (6.6%, a difference of 0.10%), Maltese (6.5%, a difference of 0.11%), and Romanian (6.6%, a difference of 0.16%).
| Demographics | Rating | Rank | Unemployment Among Ages 25 to 29 years |
| Eastern Europeans | 74.1 /100 | #137 | Good 6.5% |
| Immigrants | Belgium | 73.8 /100 | #138 | Good 6.5% |
| Austrians | 73.8 /100 | #139 | Good 6.5% |
| Immigrants | Pakistan | 73.8 /100 | #140 | Good 6.5% |
| Maltese | 72.9 /100 | #141 | Good 6.5% |
| Slavs | 72.5 /100 | #142 | Good 6.5% |
| Lithuanians | 72.2 /100 | #143 | Good 6.5% |
| Immigrants | Micronesia | 71.5 /100 | #144 | Good 6.6% |
| Nicaraguans | 70.2 /100 | #145 | Good 6.6% |
| Romanians | 69.5 /100 | #146 | Good 6.6% |
| Immigrants | Thailand | 68.4 /100 | #147 | Good 6.6% |
| Peruvians | 68.1 /100 | #148 | Good 6.6% |
| Malaysians | 67.1 /100 | #149 | Good 6.6% |
| Finns | 66.9 /100 | #150 | Good 6.6% |
| Ukrainians | 65.5 /100 | #151 | Good 6.6% |