Alaska Native vs Immigrants from Costa Rica Unemployment Among Ages 25 to 29 years
COMPARE
Alaska Native
Immigrants from Costa Rica
Unemployment Among Ages 25 to 29 years
Unemployment Among Ages 25 to 29 years Comparison
Alaska Natives
Immigrants from Costa Rica
10.2%
UNEMPLOYMENT AMONG AGES 25 TO 29 YEARS
0.0/ 100
METRIC RATING
331st/ 347
METRIC RANK
6.7%
UNEMPLOYMENT AMONG AGES 25 TO 29 YEARS
38.3/ 100
METRIC RATING
184th/ 347
METRIC RANK
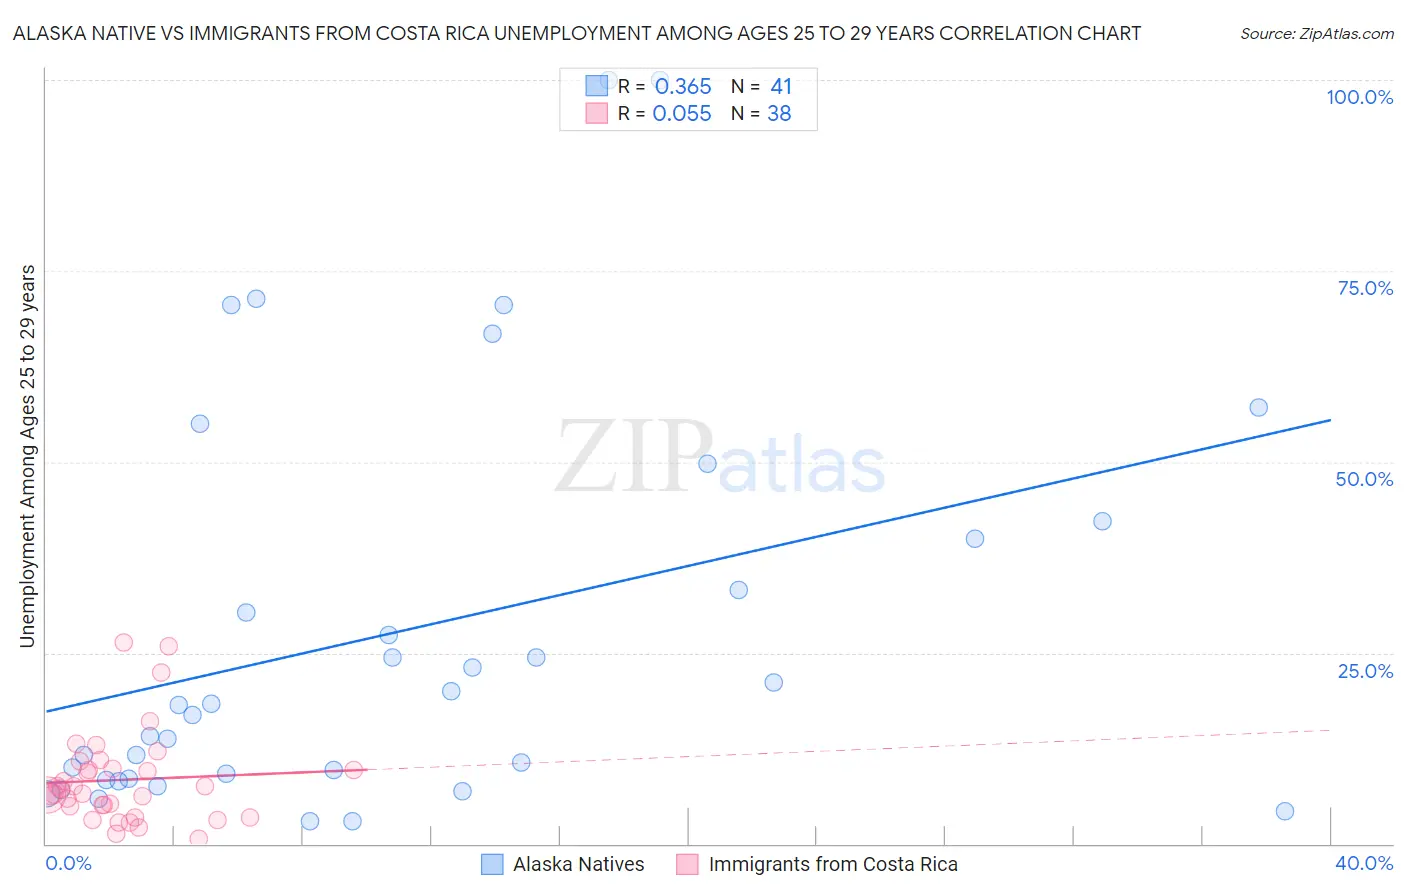
Alaska Native vs Immigrants from Costa Rica Unemployment Among Ages 25 to 29 years Correlation Chart
The statistical analysis conducted on geographies consisting of 75,796,081 people shows a mild positive correlation between the proportion of Alaska Natives and unemployment rate among population between the ages 25 and 29 in the United States with a correlation coefficient (R) of 0.365 and weighted average of 10.2%. Similarly, the statistical analysis conducted on geographies consisting of 199,784,967 people shows a slight positive correlation between the proportion of Immigrants from Costa Rica and unemployment rate among population between the ages 25 and 29 in the United States with a correlation coefficient (R) of 0.055 and weighted average of 6.7%, a difference of 52.3%.
Unemployment Among Ages 25 to 29 years Correlation Summary
| Measurement | Alaska Native | Immigrants from Costa Rica |
| Minimum | 2.9% | 0.60% |
| Maximum | 100.0% | 26.3% |
| Range | 97.1% | 25.7% |
| Mean | 27.8% | 8.4% |
| Median | 18.1% | 6.9% |
| Interquartile 25% (IQ1) | 8.4% | 4.9% |
| Interquartile 75% (IQ3) | 41.1% | 9.8% |
| Interquartile Range (IQR) | 32.7% | 4.9% |
| Standard Deviation (Sample) | 26.4% | 6.0% |
| Standard Deviation (Population) | 26.0% | 6.0% |
Similar Demographics by Unemployment Among Ages 25 to 29 years
Demographics Similar to Alaska Natives by Unemployment Among Ages 25 to 29 years
In terms of unemployment among ages 25 to 29 years, the demographic groups most similar to Alaska Natives are Pueblo (10.4%, a difference of 2.3%), Native/Alaskan (9.8%, a difference of 3.7%), Aleut (9.7%, a difference of 5.2%), Alaskan Athabascan (10.8%, a difference of 5.8%), and Apache (9.5%, a difference of 7.5%).
| Demographics | Rating | Rank | Unemployment Among Ages 25 to 29 years |
| Houma | 0.0 /100 | #324 | Tragic 8.7% |
| Yakama | 0.0 /100 | #325 | Tragic 8.8% |
| Shoshone | 0.0 /100 | #326 | Tragic 9.2% |
| Colville | 0.0 /100 | #327 | Tragic 9.2% |
| Apache | 0.0 /100 | #328 | Tragic 9.5% |
| Aleuts | 0.0 /100 | #329 | Tragic 9.7% |
| Natives/Alaskans | 0.0 /100 | #330 | Tragic 9.8% |
| Alaska Natives | 0.0 /100 | #331 | Tragic 10.2% |
| Pueblo | 0.0 /100 | #332 | Tragic 10.4% |
| Alaskan Athabascans | 0.0 /100 | #333 | Tragic 10.8% |
| Yuman | 0.0 /100 | #334 | Tragic 11.0% |
| Puerto Ricans | 0.0 /100 | #335 | Tragic 11.1% |
| Lumbee | 0.0 /100 | #336 | Tragic 11.2% |
| Menominee | 0.0 /100 | #337 | Tragic 11.3% |
| Sioux | 0.0 /100 | #338 | Tragic 11.7% |
Demographics Similar to Immigrants from Costa Rica by Unemployment Among Ages 25 to 29 years
In terms of unemployment among ages 25 to 29 years, the demographic groups most similar to Immigrants from Costa Rica are Immigrants from Scotland (6.7%, a difference of 0.090%), Czechoslovakian (6.7%, a difference of 0.15%), Moroccan (6.7%, a difference of 0.16%), Immigrants from Africa (6.7%, a difference of 0.18%), and Immigrants from Western Europe (6.7%, a difference of 0.18%).
| Demographics | Rating | Rank | Unemployment Among Ages 25 to 29 years |
| Immigrants | Israel | 47.8 /100 | #177 | Average 6.7% |
| Immigrants | Iraq | 45.1 /100 | #178 | Average 6.7% |
| Costa Ricans | 44.9 /100 | #179 | Average 6.7% |
| Immigrants | Africa | 41.1 /100 | #180 | Average 6.7% |
| Immigrants | Western Europe | 41.1 /100 | #181 | Average 6.7% |
| Czechoslovakians | 40.7 /100 | #182 | Average 6.7% |
| Immigrants | Scotland | 39.6 /100 | #183 | Fair 6.7% |
| Immigrants | Costa Rica | 38.3 /100 | #184 | Fair 6.7% |
| Moroccans | 35.9 /100 | #185 | Fair 6.7% |
| Immigrants | Iran | 34.4 /100 | #186 | Fair 6.7% |
| Immigrants | South America | 33.0 /100 | #187 | Fair 6.7% |
| Irish | 32.8 /100 | #188 | Fair 6.7% |
| Argentineans | 32.1 /100 | #189 | Fair 6.7% |
| Koreans | 29.3 /100 | #190 | Fair 6.7% |
| Chickasaw | 28.7 /100 | #191 | Fair 6.7% |