Filipino vs Immigrants from Belgium Unemployment Among Ages 55 to 59 years
COMPARE
Filipino
Immigrants from Belgium
Unemployment Among Ages 55 to 59 years
Unemployment Among Ages 55 to 59 years Comparison
Filipinos
Immigrants from Belgium
4.6%
UNEMPLOYMENT AMONG AGES 55 TO 59 YEARS
98.8/ 100
METRIC RATING
70th/ 347
METRIC RANK
4.7%
UNEMPLOYMENT AMONG AGES 55 TO 59 YEARS
95.0/ 100
METRIC RATING
96th/ 347
METRIC RANK
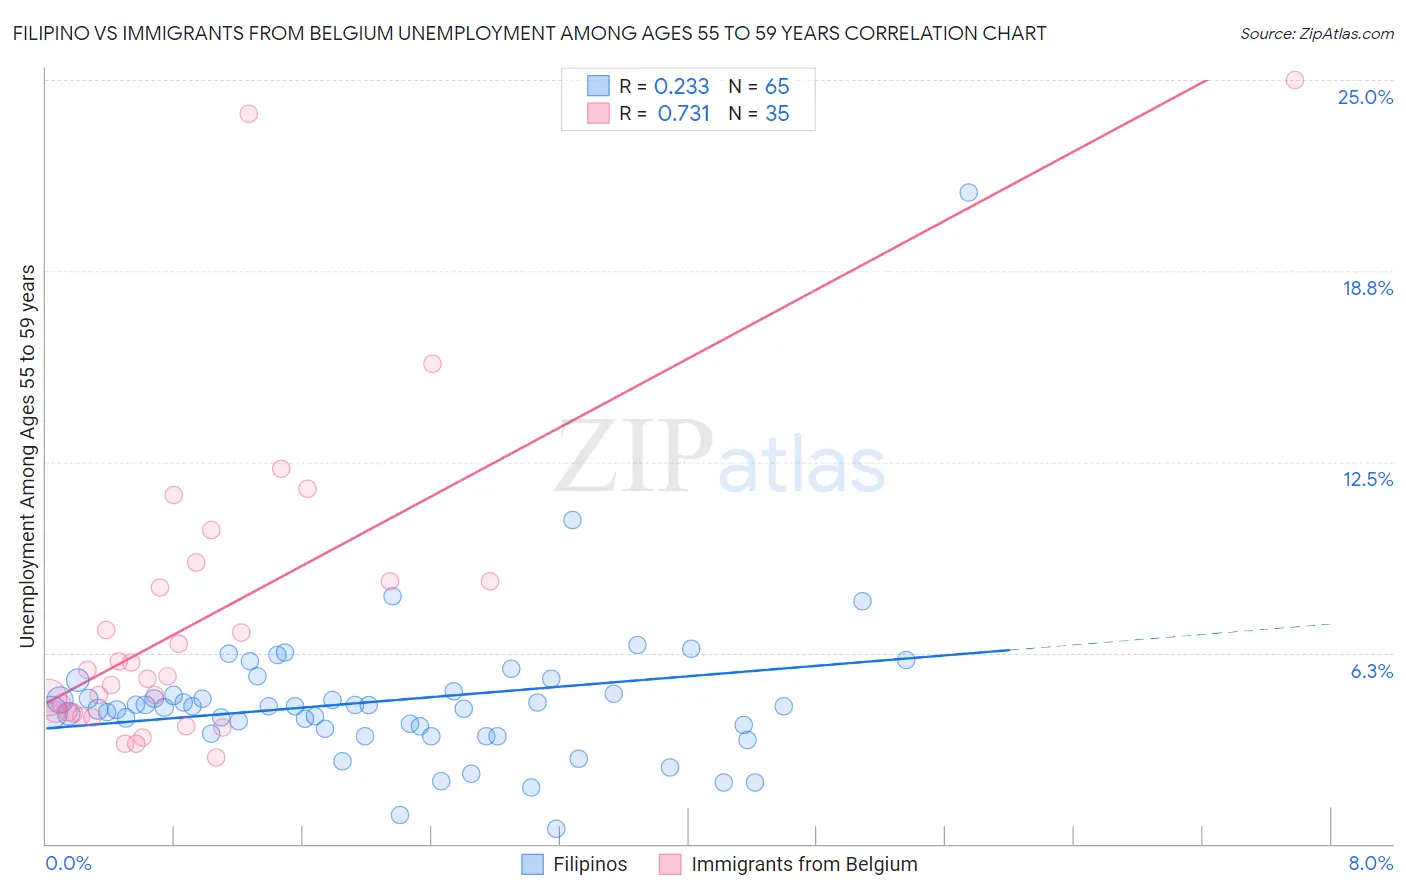
Filipino vs Immigrants from Belgium Unemployment Among Ages 55 to 59 years Correlation Chart
The statistical analysis conducted on geographies consisting of 243,640,495 people shows a weak positive correlation between the proportion of Filipinos and unemployment rate among population between the ages 55 and 59 in the United States with a correlation coefficient (R) of 0.233 and weighted average of 4.6%. Similarly, the statistical analysis conducted on geographies consisting of 142,844,772 people shows a strong positive correlation between the proportion of Immigrants from Belgium and unemployment rate among population between the ages 55 and 59 in the United States with a correlation coefficient (R) of 0.731 and weighted average of 4.7%, a difference of 1.5%.
Unemployment Among Ages 55 to 59 years Correlation Summary
| Measurement | Filipino | Immigrants from Belgium |
| Minimum | 0.50% | 2.8% |
| Maximum | 21.3% | 25.0% |
| Range | 20.8% | 22.2% |
| Mean | 4.7% | 7.4% |
| Median | 4.5% | 5.5% |
| Interquartile 25% (IQ1) | 3.7% | 4.3% |
| Interquartile 75% (IQ3) | 5.0% | 8.6% |
| Interquartile Range (IQR) | 1.3% | 4.3% |
| Standard Deviation (Sample) | 2.6% | 5.2% |
| Standard Deviation (Population) | 2.6% | 5.1% |
Similar Demographics by Unemployment Among Ages 55 to 59 years
Demographics Similar to Filipinos by Unemployment Among Ages 55 to 59 years
In terms of unemployment among ages 55 to 59 years, the demographic groups most similar to Filipinos are Immigrants from Jordan (4.6%, a difference of 0.030%), Immigrants from Taiwan (4.6%, a difference of 0.070%), Bhutanese (4.6%, a difference of 0.14%), Czechoslovakian (4.6%, a difference of 0.20%), and Immigrants from Micronesia (4.6%, a difference of 0.21%).
| Demographics | Rating | Rank | Unemployment Among Ages 55 to 59 years |
| Immigrants | South Central Asia | 99.3 /100 | #63 | Exceptional 4.6% |
| Argentineans | 99.1 /100 | #64 | Exceptional 4.6% |
| Sudanese | 99.1 /100 | #65 | Exceptional 4.6% |
| Mongolians | 99.0 /100 | #66 | Exceptional 4.6% |
| Ugandans | 99.0 /100 | #67 | Exceptional 4.6% |
| Immigrants | Micronesia | 99.0 /100 | #68 | Exceptional 4.6% |
| Czechoslovakians | 99.0 /100 | #69 | Exceptional 4.6% |
| Filipinos | 98.8 /100 | #70 | Exceptional 4.6% |
| Immigrants | Jordan | 98.7 /100 | #71 | Exceptional 4.6% |
| Immigrants | Taiwan | 98.7 /100 | #72 | Exceptional 4.6% |
| Bhutanese | 98.6 /100 | #73 | Exceptional 4.6% |
| Croatians | 98.5 /100 | #74 | Exceptional 4.6% |
| Immigrants | Iraq | 98.5 /100 | #75 | Exceptional 4.6% |
| Immigrants | Bosnia and Herzegovina | 98.3 /100 | #76 | Exceptional 4.6% |
| Scotch-Irish | 98.3 /100 | #77 | Exceptional 4.6% |
Demographics Similar to Immigrants from Belgium by Unemployment Among Ages 55 to 59 years
In terms of unemployment among ages 55 to 59 years, the demographic groups most similar to Immigrants from Belgium are Immigrants from Canada (4.7%, a difference of 0.010%), Immigrants from Germany (4.7%, a difference of 0.030%), Yugoslavian (4.7%, a difference of 0.050%), Serbian (4.7%, a difference of 0.12%), and Celtic (4.7%, a difference of 0.13%).
| Demographics | Rating | Rank | Unemployment Among Ages 55 to 59 years |
| Irish | 96.8 /100 | #89 | Exceptional 4.7% |
| Immigrants | Poland | 96.4 /100 | #90 | Exceptional 4.7% |
| New Zealanders | 96.3 /100 | #91 | Exceptional 4.7% |
| Iraqis | 96.1 /100 | #92 | Exceptional 4.7% |
| Immigrants | England | 95.8 /100 | #93 | Exceptional 4.7% |
| Immigrants | Scotland | 95.7 /100 | #94 | Exceptional 4.7% |
| South Africans | 95.6 /100 | #95 | Exceptional 4.7% |
| Immigrants | Belgium | 95.0 /100 | #96 | Exceptional 4.7% |
| Immigrants | Canada | 94.9 /100 | #97 | Exceptional 4.7% |
| Immigrants | Germany | 94.8 /100 | #98 | Exceptional 4.7% |
| Yugoslavians | 94.7 /100 | #99 | Exceptional 4.7% |
| Serbians | 94.4 /100 | #100 | Exceptional 4.7% |
| Celtics | 94.3 /100 | #101 | Exceptional 4.7% |
| Canadians | 94.1 /100 | #102 | Exceptional 4.7% |
| Immigrants | Oceania | 94.0 /100 | #103 | Exceptional 4.7% |