Afghan vs Luxembourger Female Unemployment

COMPARE

Afghan
Race
Ancestry
AfghanAfricanAlaska NativeAlaskan AthabascanAlbanianAleutAlsatianAmericanApacheArabArapahoArgentineanArmenianAssyrian/Chaldean/SyriacAustralianAustrianBahamianBangladeshiBarbadianBasqueBelgianBelizeanBermudanBhutaneseBlackfeetBolivianBrazilianBritishBritish West IndianBulgarianBurmeseCajunCambodianCanadianCape VerdeanCarpatho RusynCelticCentral AmericanCentral American IndianCherokeeCheyenneChickasawChileanChineseChippewaChoctawColombianColvilleComancheCosta RicanCreeCreekCroatianCrowCubanCypriotCzechCzechoslovakianDanishDelawareDominicanDutchDutch West IndianEastern EuropeanEcuadorianEgyptianEnglishEstonianEthiopianEuropeanFijianFilipinoFinnishFrenchFrench American IndianFrench CanadianGermanGerman RussianGhanaianGreekGuamanian/ChamorroGuatemalanGuyaneseHaitianHmongHonduranHopiHoumaHungarianIcelanderIndian (Asian)IndonesianInupiatIranianIraqiIrishIroquoisIsraeliItalianJamaicanJapaneseJordanianKenyanKiowaKoreanLaotianLatvianLebaneseLiberianLithuanianLumbeeMacedonianMalaysianMalteseMarshalleseMenomineeMexicanMexican American IndianMongolianMoroccanNative HawaiianNavajoNepaleseNew ZealanderNicaraguanNigerianNorthern EuropeanNorwegianOkinawanOsageOttawaPaiutePakistaniPalestinianPanamanianParaguayanPennsylvania GermanPeruvianPimaPolishPortuguesePotawatomiPuebloPuerto RicanPuget Sound SalishRomanianRussianSalvadoranSamoanScandinavianScotch-IrishScottishSeminoleSenegaleseSerbianShoshoneSierra LeoneanSiouxSlavicSlovakSloveneSomaliSouth AfricanSouth AmericanSouth American IndianSoviet UnionSpaniardSpanishSpanish AmericanSpanish American IndianSri LankanSubsaharan AfricanSudaneseSwedishSwissSyrianTaiwaneseThaiTlingit-HaidaTohono O'OdhamTonganTrinidadian and TobagonianTsimshianTurkishU.S. Virgin IslanderUgandanUkrainianUruguayanUteVenezuelanVietnameseWelshWest IndianYakamaYaquiYugoslavianYumanYup'ikZimbabwean
Immigration
NonimmigrantsImmigrantsAfghanistanAfricaAlbaniaArgentinaArmeniaAsiaAustraliaAustriaBahamasBangladeshBarbadosBelarusBelgiumBelizeBoliviaBosnia and HerzegovinaBrazilBulgariaBurma/MyanmarCabo VerdeCambodiaCameroonCanadaCaribbeanCentral AmericaChileChinaColombiaCongoCosta RicaCroatiaCubaCzechoslovakiaDenmarkDominicaDominican RepublicEastern AfricaEastern AsiaEastern EuropeEcuadorEgyptEl SalvadorEnglandEritreaEthiopiaEuropeFijiFranceGermanyGhanaGreeceGrenadaGuatemalaGuyanaHaitiHondurasHong KongHungaryIndiaIndonesiaIranIraqIrelandIsraelItalyJamaicaJapanJordanKazakhstanKenyaKoreaKuwaitLaosLatin AmericaLatviaLebanonLiberiaLithuaniaMalaysiaMexicoMicronesiaMiddle AfricaMoldovaMoroccoNepalNetherlandsNicaraguaNigeriaNorth AmericaNorth MacedoniaNorthern AfricaNorthern EuropeNorwayOceaniaPakistanPanamaPeruPhilippinesPolandPortugalRomaniaRussiaSaudi ArabiaScotlandSenegalSerbiaSierra LeoneSingaporeSomaliaSouth AfricaSouth AmericaSouth Central AsiaSouth Eastern AsiaSouthern EuropeSpainSri LankaSt. Vincent and the GrenadinesSudanSwedenSwitzerlandSyriaTaiwanThailandTrinidad and TobagoTurkeyUgandaUkraineUruguayUzbekistanVenezuelaVietnamWest IndiesWestern AfricaWestern AsiaWestern EuropeYemenZaireZimbabweAzores
Luxembourger
Race
Ancestry
AfricanAlaska NativeAlaskan AthabascanAlbanianAleutAlsatianAmericanApacheArabArapahoArgentineanArmenianAssyrian/Chaldean/SyriacAustralianAustrianBahamianBangladeshiBarbadianBasqueBelgianBelizeanBermudanBhutaneseBlackfeetBolivianBrazilianBritishBritish West IndianBulgarianBurmeseCajunCambodianCanadianCape VerdeanCarpatho RusynCelticCentral AmericanCentral American IndianCherokeeCheyenneChickasawChileanChineseChippewaChoctawColombianColvilleComancheCosta RicanCreeCreekCroatianCrowCubanCypriotCzechCzechoslovakianDanishDelawareDominicanDutchDutch West IndianEastern EuropeanEcuadorianEgyptianEnglishEstonianEthiopianEuropeanFijianFilipinoFinnishFrenchFrench American IndianFrench CanadianGermanGerman RussianGhanaianGreekGuamanian/ChamorroGuatemalanGuyaneseHaitianHmongHonduranHopiHoumaHungarianIcelanderIndian (Asian)IndonesianInupiatIranianIraqiIrishIroquoisIsraeliItalianJamaicanJapaneseJordanianKenyanKiowaKoreanLaotianLatvianLebaneseLiberianLithuanianLumbeeLuxembourgerMacedonianMalaysianMalteseMarshalleseMenomineeMexicanMexican American IndianMongolianMoroccanNative HawaiianNavajoNepaleseNew ZealanderNicaraguanNigerianNorthern EuropeanNorwegianOkinawanOsageOttawaPaiutePakistaniPalestinianPanamanianParaguayanPennsylvania GermanPeruvianPimaPolishPortuguesePotawatomiPuebloPuerto RicanPuget Sound SalishRomanianRussianSalvadoranSamoanScandinavianScotch-IrishScottishSeminoleSenegaleseSerbianShoshoneSierra LeoneanSiouxSlavicSlovakSloveneSomaliSouth AfricanSouth AmericanSouth American IndianSoviet UnionSpaniardSpanishSpanish AmericanSpanish American IndianSri LankanSubsaharan AfricanSudaneseSwedishSwissSyrianTaiwaneseThaiTlingit-HaidaTohono O'OdhamTonganTrinidadian and TobagonianTsimshianTurkishU.S. Virgin IslanderUgandanUkrainianUruguayanUteVenezuelanVietnameseWelshWest IndianYakamaYaquiYugoslavianYumanYup'ikZimbabwean
Immigration
NonimmigrantsImmigrantsAfghanistanAfricaAlbaniaArgentinaArmeniaAsiaAustraliaAustriaBahamasBangladeshBarbadosBelarusBelgiumBelizeBoliviaBosnia and HerzegovinaBrazilBulgariaBurma/MyanmarCabo VerdeCambodiaCameroonCanadaCaribbeanCentral AmericaChileChinaColombiaCongoCosta RicaCroatiaCubaCzechoslovakiaDenmarkDominicaDominican RepublicEastern AfricaEastern AsiaEastern EuropeEcuadorEgyptEl SalvadorEnglandEritreaEthiopiaEuropeFijiFranceGermanyGhanaGreeceGrenadaGuatemalaGuyanaHaitiHondurasHong KongHungaryIndiaIndonesiaIranIraqIrelandIsraelItalyJamaicaJapanJordanKazakhstanKenyaKoreaKuwaitLaosLatin AmericaLatviaLebanonLiberiaLithuaniaMalaysiaMexicoMicronesiaMiddle AfricaMoldovaMoroccoNepalNetherlandsNicaraguaNigeriaNorth AmericaNorth MacedoniaNorthern AfricaNorthern EuropeNorwayOceaniaPakistanPanamaPeruPhilippinesPolandPortugalRomaniaRussiaSaudi ArabiaScotlandSenegalSerbiaSierra LeoneSingaporeSomaliaSouth AfricaSouth AmericaSouth Central AsiaSouth Eastern AsiaSouthern EuropeSpainSri LankaSt. Vincent and the GrenadinesSudanSwedenSwitzerlandSyriaTaiwanThailandTrinidad and TobagoTurkeyUgandaUkraineUruguayUzbekistanVenezuelaVietnamWest IndiesWestern AfricaWestern AsiaWestern EuropeYemenZaireZimbabweAzores
Female Unemployment
Income
Poverty
Unemployment
Labor Participation
Family Structure
Vehicle Availability
Education Level
Disability

Female Unemployment Comparison

Afghans

Luxembourgers

Fair
Exceptional
5.3%
FEMALE UNEMPLOYMENT
33.9/ 100
METRIC RATING
188th/ 347
METRIC RANK
4.4%
FEMALE UNEMPLOYMENT
100.0/ 100
METRIC RATING
3rd/ 347
METRIC RANK

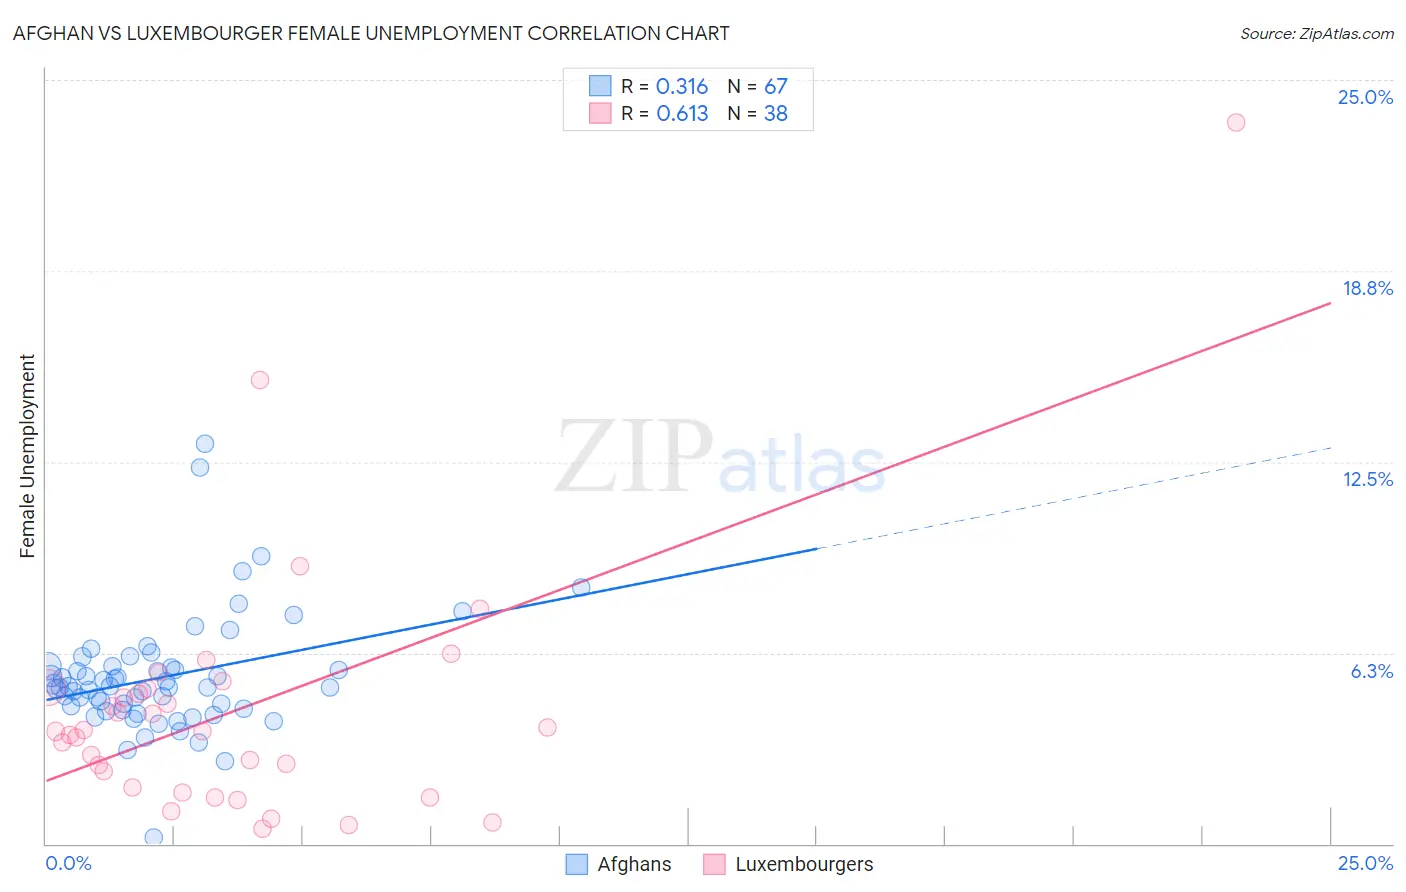
Afghan vs Luxembourger Female Unemployment Correlation Chart

The statistical analysis conducted on geographies consisting of 148,787,124 people shows a mild positive correlation between the proportion of Afghans and unemploymnet rate among females in the United States with a correlation coefficient (R) of 0.316 and weighted average of 5.3%. Similarly, the statistical analysis conducted on geographies consisting of 144,033,637 people shows a significant positive correlation between the proportion of Luxembourgers and unemploymnet rate among females in the United States with a correlation coefficient (R) of 0.613 and weighted average of 4.4%, a difference of 21.0%.
Afghan vs Luxembourger Female Unemployment

Female Unemployment Correlation Summary

MeasurementAfghanLuxembourger
Minimum0.20%0.50%
Maximum13.1%23.6%
Range12.9%23.1%
Mean5.4%4.4%
Median5.1%3.7%
Interquartile 25% (IQ1)4.4%1.8%
Interquartile 75% (IQ3)5.8%5.1%
Interquartile Range (IQR)1.4%3.2%
Standard Deviation (Sample)1.9%4.2%
Standard Deviation (Population)1.9%4.2%

Similar Demographics by Female Unemployment

Demographics Similar to Afghans by Female Unemployment

In terms of female unemployment, the demographic groups most similar to Afghans are Costa Rican (5.3%, a difference of 0.0%), Immigrants from Albania (5.3%, a difference of 0.10%), Ugandan (5.3%, a difference of 0.18%), Cherokee (5.3%, a difference of 0.21%), and Immigrants from Belarus (5.3%, a difference of 0.35%).
DemographicsRating | RankFemale Unemployment
Taiwanese
42.7
/100
|
#181
Average
5.3%
Immigrants | Nonimmigrants
42.6
/100
|
#182
Average
5.3%
Immigrants | Indonesia
40.7
/100
|
#183
Average
5.3%
Immigrants | Ukraine
40.1
/100
|
#184
Average
5.3%
Malaysians
40.1
/100
|
#185
Average
5.3%
Immigrants | Belarus
39.4
/100
|
#186
Fair
5.3%
Immigrants | Albania
35.4
/100
|
#187
Fair
5.3%
Afghans
33.9
/100
|
#188
Fair
5.3%
Costa Ricans
33.8
/100
|
#189
Fair
5.3%
Ugandans
31.2
/100
|
#190
Fair
5.3%
Cherokee
30.8
/100
|
#191
Fair
5.3%
Portuguese
28.6
/100
|
#192
Fair
5.3%
Arabs
27.7
/100
|
#193
Fair
5.3%
Colombians
27.0
/100
|
#194
Fair
5.3%
Immigrants | Colombia
26.2
/100
|
#195
Fair
5.3%

Demographics Similar to Luxembourgers by Female Unemployment

In terms of female unemployment, the demographic groups most similar to Luxembourgers are Czech (4.4%, a difference of 0.010%), Danish (4.4%, a difference of 0.030%), Hmong (4.4%, a difference of 0.14%), Swedish (4.4%, a difference of 1.4%), and Chinese (4.5%, a difference of 2.2%).
DemographicsRating | RankFemale Unemployment
Norwegians
100.0
/100
|
#1
Exceptional
4.2%
Czechs
100.0
/100
|
#2
Exceptional
4.4%
Luxembourgers
100.0
/100
|
#3
Exceptional
4.4%
Danes
100.0
/100
|
#4
Exceptional
4.4%
Hmong
100.0
/100
|
#5
Exceptional
4.4%
Swedes
100.0
/100
|
#6
Exceptional
4.4%
Chinese
100.0
/100
|
#7
Exceptional
4.5%
Germans
100.0
/100
|
#8
Exceptional
4.5%
Slovenes
100.0
/100
|
#9
Exceptional
4.5%
Swiss
100.0
/100
|
#10
Exceptional
4.6%
Scandinavians
100.0
/100
|
#11
Exceptional
4.6%
Dutch
100.0
/100
|
#12
Exceptional
4.6%
Belgians
100.0
/100
|
#13
Exceptional
4.6%
Finns
100.0
/100
|
#14
Exceptional
4.6%
English
100.0
/100
|
#15
Exceptional
4.6%