Immigrants from Korea vs Basque Child Poverty Under the Age of 5
COMPARE
Immigrants from Korea
Basque
Child Poverty Under the Age of 5
Child Poverty Under the Age of 5 Comparison
Immigrants from Korea
Basques
13.2%
CHILD POVERTY UNDER THE AGE OF 5
100.0/ 100
METRIC RATING
11th/ 347
METRIC RANK
16.0%
CHILD POVERTY UNDER THE AGE OF 5
93.4/ 100
METRIC RATING
117th/ 347
METRIC RANK
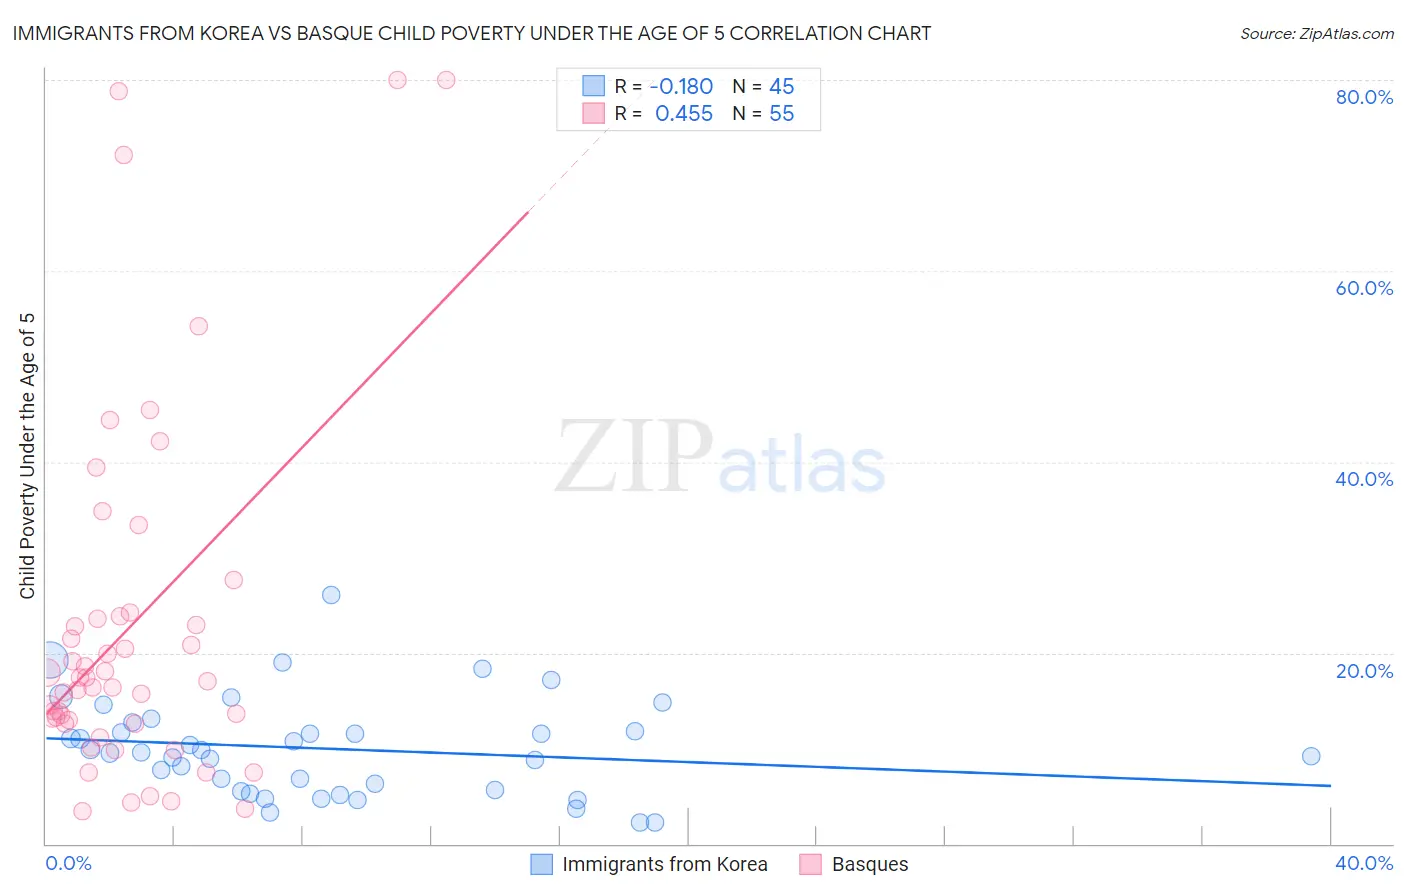
Immigrants from Korea vs Basque Child Poverty Under the Age of 5 Correlation Chart
The statistical analysis conducted on geographies consisting of 396,775,886 people shows a poor negative correlation between the proportion of Immigrants from Korea and poverty level among children under the age of 5 in the United States with a correlation coefficient (R) of -0.180 and weighted average of 13.2%. Similarly, the statistical analysis conducted on geographies consisting of 162,359,571 people shows a moderate positive correlation between the proportion of Basques and poverty level among children under the age of 5 in the United States with a correlation coefficient (R) of 0.455 and weighted average of 16.0%, a difference of 21.2%.
Child Poverty Under the Age of 5 Correlation Summary
| Measurement | Immigrants from Korea | Basque |
| Minimum | 2.2% | 3.4% |
| Maximum | 26.0% | 80.0% |
| Range | 23.8% | 76.6% |
| Mean | 10.0% | 22.8% |
| Median | 9.6% | 17.1% |
| Interquartile 25% (IQ1) | 5.6% | 12.6% |
| Interquartile 75% (IQ3) | 12.3% | 23.8% |
| Interquartile Range (IQR) | 6.7% | 11.2% |
| Standard Deviation (Sample) | 5.1% | 19.0% |
| Standard Deviation (Population) | 5.0% | 18.8% |
Similar Demographics by Child Poverty Under the Age of 5
Demographics Similar to Immigrants from Korea by Child Poverty Under the Age of 5
In terms of child poverty under the age of 5, the demographic groups most similar to Immigrants from Korea are Immigrants from South Central Asia (13.3%, a difference of 0.10%), Burmese (13.2%, a difference of 0.11%), Bhutanese (13.4%, a difference of 0.86%), Immigrants from Iran (13.1%, a difference of 1.2%), and Iranian (13.1%, a difference of 1.4%).
| Demographics | Rating | Rank | Child Poverty Under the Age of 5 |
| Thais | 100.0 /100 | #4 | Exceptional 12.3% |
| Immigrants | Hong Kong | 100.0 /100 | #5 | Exceptional 12.4% |
| Immigrants | Singapore | 100.0 /100 | #6 | Exceptional 12.9% |
| Chinese | 100.0 /100 | #7 | Exceptional 13.1% |
| Iranians | 100.0 /100 | #8 | Exceptional 13.1% |
| Immigrants | Iran | 100.0 /100 | #9 | Exceptional 13.1% |
| Burmese | 100.0 /100 | #10 | Exceptional 13.2% |
| Immigrants | Korea | 100.0 /100 | #11 | Exceptional 13.2% |
| Immigrants | South Central Asia | 100.0 /100 | #12 | Exceptional 13.3% |
| Bhutanese | 100.0 /100 | #13 | Exceptional 13.4% |
| Okinawans | 100.0 /100 | #14 | Exceptional 13.4% |
| Indians (Asian) | 100.0 /100 | #15 | Exceptional 13.4% |
| Immigrants | Eastern Asia | 100.0 /100 | #16 | Exceptional 13.5% |
| Assyrians/Chaldeans/Syriacs | 100.0 /100 | #17 | Exceptional 13.6% |
| Immigrants | China | 100.0 /100 | #18 | Exceptional 13.6% |
Demographics Similar to Basques by Child Poverty Under the Age of 5
In terms of child poverty under the age of 5, the demographic groups most similar to Basques are Immigrants from Denmark (16.0%, a difference of 0.0%), Immigrants from Austria (16.0%, a difference of 0.020%), Immigrants from Jordan (16.1%, a difference of 0.11%), Albanian (16.0%, a difference of 0.18%), and Immigrants from Kuwait (16.0%, a difference of 0.21%).
| Demographics | Rating | Rank | Child Poverty Under the Age of 5 |
| Romanians | 94.3 /100 | #110 | Exceptional 16.0% |
| Pakistanis | 94.2 /100 | #111 | Exceptional 16.0% |
| Peruvians | 94.1 /100 | #112 | Exceptional 16.0% |
| Puget Sound Salish | 94.1 /100 | #113 | Exceptional 16.0% |
| Immigrants | Kuwait | 93.9 /100 | #114 | Exceptional 16.0% |
| Albanians | 93.8 /100 | #115 | Exceptional 16.0% |
| Immigrants | Austria | 93.5 /100 | #116 | Exceptional 16.0% |
| Basques | 93.4 /100 | #117 | Exceptional 16.0% |
| Immigrants | Denmark | 93.4 /100 | #118 | Exceptional 16.0% |
| Immigrants | Jordan | 93.2 /100 | #119 | Exceptional 16.1% |
| Immigrants | Peru | 92.6 /100 | #120 | Exceptional 16.1% |
| Mongolians | 92.5 /100 | #121 | Exceptional 16.1% |
| Immigrants | Southern Europe | 92.0 /100 | #122 | Exceptional 16.1% |
| Austrians | 92.0 /100 | #123 | Exceptional 16.1% |
| Swiss | 92.0 /100 | #124 | Exceptional 16.1% |