Yup'ik vs Inupiat Unemployment Among Ages 35 to 44 years
COMPARE
Yup'ik
Inupiat
Unemployment Among Ages 35 to 44 years
Unemployment Among Ages 35 to 44 years Comparison
Yup'ik
Inupiat
14.4%
UNEMPLOYMENT AMONG AGES 35 TO 44 YEARS
0.0/ 100
METRIC RATING
345th/ 347
METRIC RANK
8.6%
UNEMPLOYMENT AMONG AGES 35 TO 44 YEARS
0.0/ 100
METRIC RATING
339th/ 347
METRIC RANK
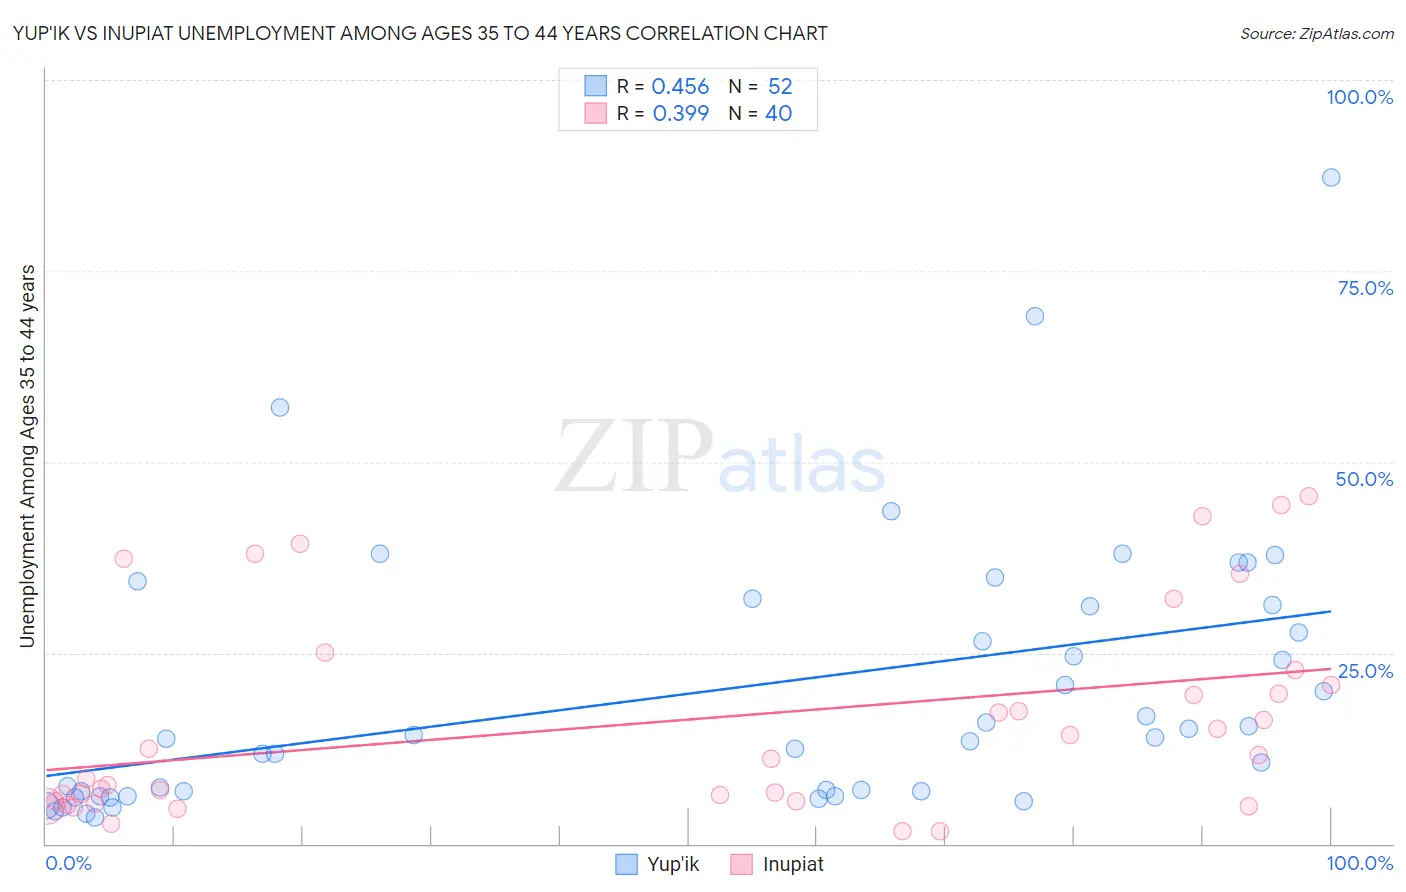
Yup'ik vs Inupiat Unemployment Among Ages 35 to 44 years Correlation Chart
The statistical analysis conducted on geographies consisting of 39,745,943 people shows a moderate positive correlation between the proportion of Yup'ik and unemployment rate among population between the ages 35 and 44 in the United States with a correlation coefficient (R) of 0.456 and weighted average of 14.4%. Similarly, the statistical analysis conducted on geographies consisting of 95,589,628 people shows a mild positive correlation between the proportion of Inupiat and unemployment rate among population between the ages 35 and 44 in the United States with a correlation coefficient (R) of 0.399 and weighted average of 8.6%, a difference of 68.4%.
Unemployment Among Ages 35 to 44 years Correlation Summary
| Measurement | Yup'ik | Inupiat |
| Minimum | 3.5% | 1.7% |
| Maximum | 87.2% | 45.5% |
| Range | 83.8% | 43.8% |
| Mean | 19.9% | 16.0% |
| Median | 13.8% | 11.4% |
| Interquartile 25% (IQ1) | 6.6% | 5.5% |
| Interquartile 75% (IQ3) | 31.2% | 21.8% |
| Interquartile Range (IQR) | 24.6% | 16.3% |
| Standard Deviation (Sample) | 17.6% | 13.3% |
| Standard Deviation (Population) | 17.5% | 13.2% |
Demographics Similar to Yup'ik and Inupiat by Unemployment Among Ages 35 to 44 years
In terms of unemployment among ages 35 to 44 years, the demographic groups most similar to Yup'ik are Crow (15.7%, a difference of 8.8%), Yuman (16.9%, a difference of 17.2%), Pima (11.8%, a difference of 22.8%), Arapaho (10.3%, a difference of 40.3%), and Navajo (9.3%, a difference of 54.6%). Similarly, the demographic groups most similar to Inupiat are Alaskan Athabascan (8.6%, a difference of 0.69%), Cheyenne (8.5%, a difference of 1.1%), Tohono O'odham (8.4%, a difference of 1.6%), Apache (8.4%, a difference of 2.0%), and Sioux (8.4%, a difference of 2.3%).
| Demographics | Rating | Rank | Unemployment Among Ages 35 to 44 years |
| Shoshone | 0.0 /100 | #328 | Tragic 6.6% |
| Paiute | 0.0 /100 | #329 | Tragic 6.9% |
| Immigrants | Cabo Verde | 0.0 /100 | #330 | Tragic 6.9% |
| Pueblo | 0.0 /100 | #331 | Tragic 7.1% |
| Natives/Alaskans | 0.0 /100 | #332 | Tragic 7.3% |
| Puerto Ricans | 0.0 /100 | #333 | Tragic 7.6% |
| Houma | 0.0 /100 | #334 | Tragic 7.8% |
| Sioux | 0.0 /100 | #335 | Tragic 8.4% |
| Apache | 0.0 /100 | #336 | Tragic 8.4% |
| Tohono O'odham | 0.0 /100 | #337 | Tragic 8.4% |
| Cheyenne | 0.0 /100 | #338 | Tragic 8.5% |
| Inupiat | 0.0 /100 | #339 | Tragic 8.6% |
| Alaskan Athabascans | 0.0 /100 | #340 | Tragic 8.6% |
| Hopi | 0.0 /100 | #341 | Tragic 8.9% |
| Navajo | 0.0 /100 | #342 | Tragic 9.3% |
| Arapaho | 0.0 /100 | #343 | Tragic 10.3% |
| Pima | 0.0 /100 | #344 | Tragic 11.8% |
| Yup'ik | 0.0 /100 | #345 | Tragic 14.4% |
| Crow | 0.0 /100 | #346 | Tragic 15.7% |
| Yuman | 0.0 /100 | #347 | Tragic 16.9% |