Yugoslavian vs Palestinian Single Male Poverty
COMPARE
Yugoslavian
Palestinian
Single Male Poverty
Single Male Poverty Comparison
Yugoslavians
Palestinians
12.6%
SINGLE MALE POVERTY
73.9/ 100
METRIC RATING
148th/ 347
METRIC RANK
12.7%
SINGLE MALE POVERTY
63.1/ 100
METRIC RATING
163rd/ 347
METRIC RANK
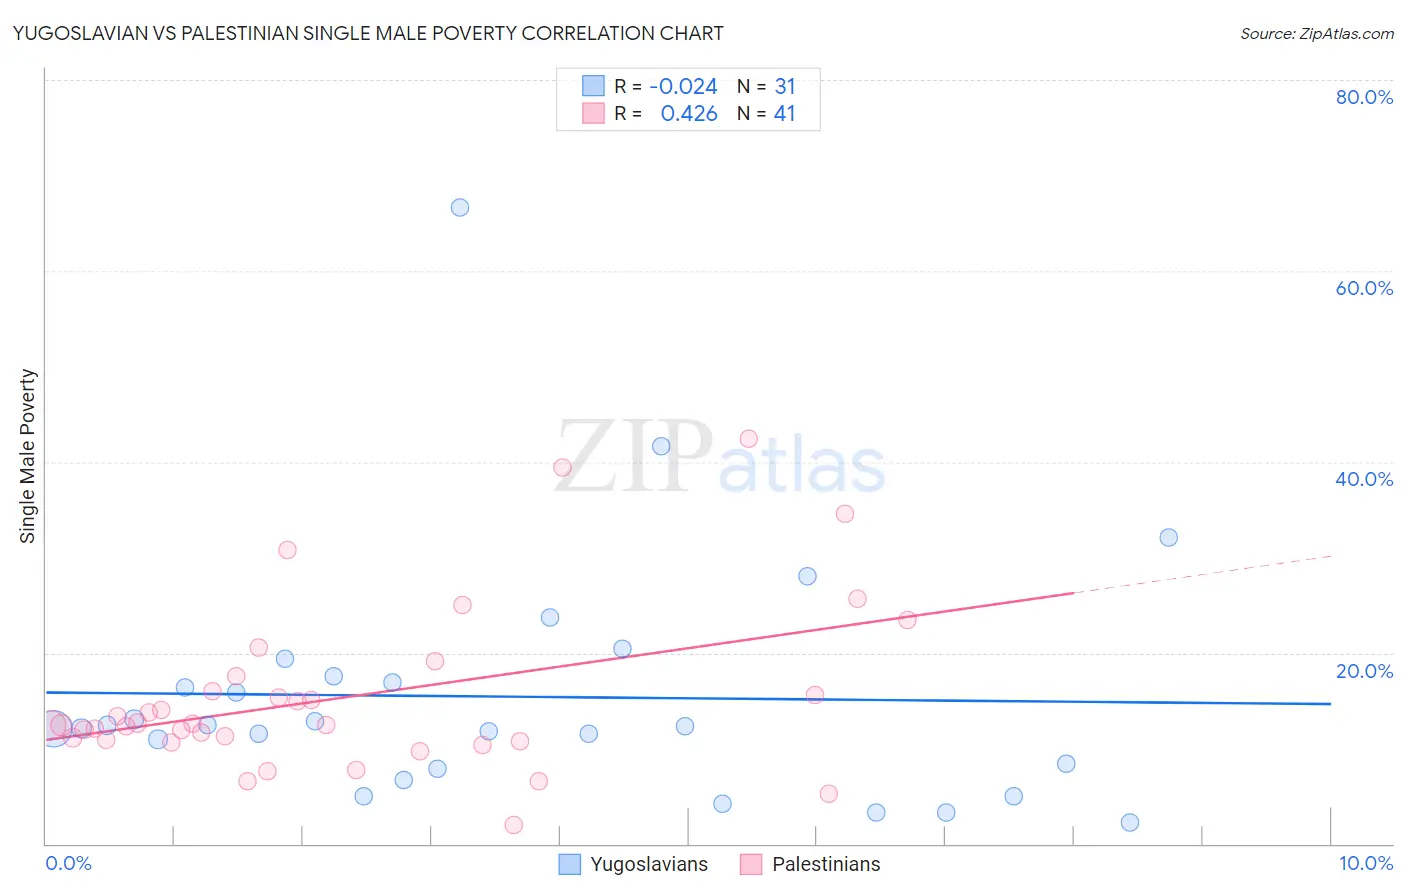
Yugoslavian vs Palestinian Single Male Poverty Correlation Chart
The statistical analysis conducted on geographies consisting of 258,600,754 people shows no correlation between the proportion of Yugoslavians and poverty level among single males in the United States with a correlation coefficient (R) of -0.024 and weighted average of 12.6%. Similarly, the statistical analysis conducted on geographies consisting of 200,638,280 people shows a moderate positive correlation between the proportion of Palestinians and poverty level among single males in the United States with a correlation coefficient (R) of 0.426 and weighted average of 12.7%, a difference of 0.68%.
Single Male Poverty Correlation Summary
| Measurement | Yugoslavian | Palestinian |
| Minimum | 2.3% | 1.9% |
| Maximum | 66.7% | 42.4% |
| Range | 64.4% | 40.5% |
| Mean | 15.4% | 15.3% |
| Median | 12.3% | 12.5% |
| Interquartile 25% (IQ1) | 7.9% | 10.8% |
| Interquartile 75% (IQ3) | 17.6% | 16.7% |
| Interquartile Range (IQR) | 9.7% | 5.9% |
| Standard Deviation (Sample) | 12.9% | 8.7% |
| Standard Deviation (Population) | 12.7% | 8.6% |
Demographics Similar to Yugoslavians and Palestinians by Single Male Poverty
In terms of single male poverty, the demographic groups most similar to Yugoslavians are Malaysian (12.6%, a difference of 0.060%), Immigrants from Lebanon (12.6%, a difference of 0.070%), Native Hawaiian (12.6%, a difference of 0.070%), Sierra Leonean (12.6%, a difference of 0.070%), and Immigrants from Panama (12.6%, a difference of 0.13%). Similarly, the demographic groups most similar to Palestinians are Eastern European (12.7%, a difference of 0.010%), Immigrants from Nigeria (12.7%, a difference of 0.010%), Immigrants from Africa (12.7%, a difference of 0.020%), Immigrants from Cambodia (12.7%, a difference of 0.050%), and Immigrants from Liberia (12.7%, a difference of 0.060%).
| Demographics | Rating | Rank | Single Male Poverty |
| Immigrants | Lebanon | 75.0 /100 | #145 | Good 12.6% |
| Native Hawaiians | 75.0 /100 | #146 | Good 12.6% |
| Malaysians | 74.8 /100 | #147 | Good 12.6% |
| Yugoslavians | 73.9 /100 | #148 | Good 12.6% |
| Sierra Leoneans | 73.0 /100 | #149 | Good 12.6% |
| Immigrants | Panama | 72.1 /100 | #150 | Good 12.6% |
| Immigrants | Hungary | 71.9 /100 | #151 | Good 12.6% |
| Australians | 71.4 /100 | #152 | Good 12.6% |
| Immigrants | Immigrants | 70.1 /100 | #153 | Good 12.7% |
| Immigrants | Scotland | 68.9 /100 | #154 | Good 12.7% |
| Immigrants | Spain | 68.7 /100 | #155 | Good 12.7% |
| Vietnamese | 67.9 /100 | #156 | Good 12.7% |
| Latvians | 67.9 /100 | #157 | Good 12.7% |
| Immigrants | Middle Africa | 64.9 /100 | #158 | Good 12.7% |
| Immigrants | Liberia | 64.2 /100 | #159 | Good 12.7% |
| Greeks | 64.1 /100 | #160 | Good 12.7% |
| Immigrants | Africa | 63.4 /100 | #161 | Good 12.7% |
| Eastern Europeans | 63.3 /100 | #162 | Good 12.7% |
| Palestinians | 63.1 /100 | #163 | Good 12.7% |
| Immigrants | Nigeria | 62.8 /100 | #164 | Good 12.7% |
| Immigrants | Cambodia | 62.2 /100 | #165 | Good 12.7% |