Immigrants from Czechoslovakia vs Palestinian Single Male Poverty

COMPARE

Immigrants from Czechoslovakia
Race
Ancestry
AfghanAfricanAlaska NativeAlaskan AthabascanAlbanianAleutAlsatianAmericanApacheArabArapahoArgentineanArmenianAssyrian/Chaldean/SyriacAustralianAustrianBahamianBangladeshiBarbadianBasqueBelgianBelizeanBermudanBhutaneseBlackfeetBolivianBrazilianBritishBritish West IndianBulgarianBurmeseCajunCambodianCanadianCape VerdeanCarpatho RusynCelticCentral AmericanCentral American IndianCherokeeCheyenneChickasawChileanChineseChippewaChoctawColombianColvilleComancheCosta RicanCreeCreekCroatianCrowCubanCypriotCzechCzechoslovakianDanishDelawareDominicanDutchDutch West IndianEastern EuropeanEcuadorianEgyptianEnglishEstonianEthiopianEuropeanFijianFilipinoFinnishFrenchFrench American IndianFrench CanadianGermanGerman RussianGhanaianGreekGuamanian/ChamorroGuatemalanGuyaneseHaitianHmongHonduranHopiHoumaHungarianIcelanderIndian (Asian)IndonesianInupiatIranianIraqiIrishIroquoisIsraeliItalianJamaicanJapaneseJordanianKenyanKiowaKoreanLaotianLatvianLebaneseLiberianLithuanianLumbeeLuxembourgerMacedonianMalaysianMalteseMarshalleseMenomineeMexicanMexican American IndianMongolianMoroccanNative HawaiianNavajoNepaleseNew ZealanderNicaraguanNigerianNorthern EuropeanNorwegianOkinawanOsageOttawaPaiutePakistaniPanamanianParaguayanPennsylvania GermanPeruvianPimaPolishPortuguesePotawatomiPuebloPuerto RicanPuget Sound SalishRomanianRussianSalvadoranSamoanScandinavianScotch-IrishScottishSeminoleSenegaleseSerbianShoshoneSierra LeoneanSiouxSlavicSlovakSloveneSomaliSouth AfricanSouth AmericanSouth American IndianSoviet UnionSpaniardSpanishSpanish AmericanSpanish American IndianSri LankanSubsaharan AfricanSudaneseSwedishSwissSyrianTaiwaneseThaiTlingit-HaidaTohono O'OdhamTonganTrinidadian and TobagonianTsimshianTurkishU.S. Virgin IslanderUgandanUkrainianUruguayanUteVenezuelanVietnameseWelshWest IndianYakamaYaquiYugoslavianYumanYup'ikZimbabwean
Immigration
NonimmigrantsImmigrantsAfghanistanAfricaAlbaniaArgentinaArmeniaAsiaAustraliaAustriaBahamasBangladeshBarbadosBelarusBelgiumBelizeBoliviaBosnia and HerzegovinaBrazilBulgariaBurma/MyanmarCabo VerdeCambodiaCameroonCanadaCaribbeanCentral AmericaChileChinaColombiaCongoCosta RicaCroatiaCubaCzechoslovakiaDenmarkDominicaDominican RepublicEastern AfricaEastern AsiaEastern EuropeEcuadorEgyptEl SalvadorEnglandEritreaEthiopiaEuropeFijiFranceGermanyGhanaGreeceGrenadaGuatemalaGuyanaHaitiHondurasHong KongHungaryIndiaIndonesiaIranIraqIrelandIsraelItalyJamaicaJapanJordanKazakhstanKenyaKoreaKuwaitLaosLatin AmericaLatviaLebanonLiberiaLithuaniaMalaysiaMexicoMicronesiaMiddle AfricaMoldovaMoroccoNepalNetherlandsNicaraguaNigeriaNorth AmericaNorth MacedoniaNorthern AfricaNorthern EuropeNorwayOceaniaPakistanPanamaPeruPhilippinesPolandPortugalRomaniaRussiaSaudi ArabiaScotlandSenegalSerbiaSierra LeoneSingaporeSomaliaSouth AfricaSouth AmericaSouth Central AsiaSouth Eastern AsiaSouthern EuropeSpainSri LankaSt. Vincent and the GrenadinesSudanSwedenSwitzerlandSyriaTaiwanThailandTrinidad and TobagoTurkeyUgandaUkraineUruguayUzbekistanVenezuelaVietnamWest IndiesWestern AfricaWestern AsiaWestern EuropeYemenZaireZimbabweAzores
Palestinian
Race
Ancestry
AfghanAfricanAlaska NativeAlaskan AthabascanAlbanianAleutAlsatianAmericanApacheArabArapahoArgentineanArmenianAssyrian/Chaldean/SyriacAustralianAustrianBahamianBangladeshiBarbadianBasqueBelgianBelizeanBermudanBhutaneseBlackfeetBolivianBrazilianBritishBritish West IndianBulgarianBurmeseCajunCambodianCanadianCape VerdeanCarpatho RusynCelticCentral AmericanCentral American IndianCherokeeCheyenneChickasawChileanChineseChippewaChoctawColombianColvilleComancheCosta RicanCreeCreekCroatianCrowCubanCypriotCzechCzechoslovakianDanishDelawareDominicanDutchDutch West IndianEastern EuropeanEcuadorianEgyptianEnglishEstonianEthiopianEuropeanFijianFilipinoFinnishFrenchFrench American IndianFrench CanadianGermanGerman RussianGhanaianGreekGuamanian/ChamorroGuatemalanGuyaneseHaitianHmongHonduranHopiHoumaHungarianIcelanderIndian (Asian)IndonesianInupiatIranianIraqiIrishIroquoisIsraeliItalianJamaicanJapaneseJordanianKenyanKiowaKoreanLaotianLatvianLebaneseLiberianLithuanianLumbeeLuxembourgerMacedonianMalaysianMalteseMarshalleseMenomineeMexicanMexican American IndianMongolianMoroccanNative HawaiianNavajoNepaleseNew ZealanderNicaraguanNigerianNorthern EuropeanNorwegianOkinawanOsageOttawaPaiutePakistaniPalestinianPanamanianParaguayanPennsylvania GermanPeruvianPimaPolishPortuguesePotawatomiPuebloPuerto RicanPuget Sound SalishRomanianRussianSalvadoranSamoanScandinavianScotch-IrishScottishSeminoleSenegaleseSerbianShoshoneSierra LeoneanSiouxSlavicSlovakSloveneSomaliSouth AfricanSouth AmericanSouth American IndianSoviet UnionSpaniardSpanishSpanish AmericanSpanish American IndianSri LankanSubsaharan AfricanSudaneseSwedishSwissSyrianTaiwaneseThaiTlingit-HaidaTohono O'OdhamTonganTrinidadian and TobagonianTsimshianTurkishU.S. Virgin IslanderUgandanUkrainianUruguayanUteVenezuelanVietnameseWelshWest IndianYakamaYaquiYugoslavianYumanYup'ikZimbabwean
Immigration
NonimmigrantsImmigrantsAfghanistanAfricaAlbaniaArgentinaArmeniaAsiaAustraliaAustriaBahamasBangladeshBarbadosBelarusBelgiumBelizeBoliviaBosnia and HerzegovinaBrazilBulgariaBurma/MyanmarCabo VerdeCambodiaCameroonCanadaCaribbeanCentral AmericaChileChinaColombiaCongoCosta RicaCroatiaCubaDenmarkDominicaDominican RepublicEastern AfricaEastern AsiaEastern EuropeEcuadorEgyptEl SalvadorEnglandEritreaEthiopiaEuropeFijiFranceGermanyGhanaGreeceGrenadaGuatemalaGuyanaHaitiHondurasHong KongHungaryIndiaIndonesiaIranIraqIrelandIsraelItalyJamaicaJapanJordanKazakhstanKenyaKoreaKuwaitLaosLatin AmericaLatviaLebanonLiberiaLithuaniaMalaysiaMexicoMicronesiaMiddle AfricaMoldovaMoroccoNepalNetherlandsNicaraguaNigeriaNorth AmericaNorth MacedoniaNorthern AfricaNorthern EuropeNorwayOceaniaPakistanPanamaPeruPhilippinesPolandPortugalRomaniaRussiaSaudi ArabiaScotlandSenegalSerbiaSierra LeoneSingaporeSomaliaSouth AfricaSouth AmericaSouth Central AsiaSouth Eastern AsiaSouthern EuropeSpainSri LankaSt. Vincent and the GrenadinesSudanSwedenSwitzerlandSyriaTaiwanThailandTrinidad and TobagoTurkeyUgandaUkraineUruguayUzbekistanVenezuelaVietnamWest IndiesWestern AfricaWestern AsiaWestern EuropeYemenZaireZimbabweAzores
Single Male Poverty
Income
Poverty
Unemployment
Labor Participation
Family Structure
Vehicle Availability
Education Level
Disability

Single Male Poverty Comparison

Immigrants from Czechoslovakia

Palestinians

Exceptional
Good
12.1%
SINGLE MALE POVERTY
98.6/ 100
METRIC RATING
84th/ 347
METRIC RANK
12.7%
SINGLE MALE POVERTY
63.1/ 100
METRIC RATING
163rd/ 347
METRIC RANK

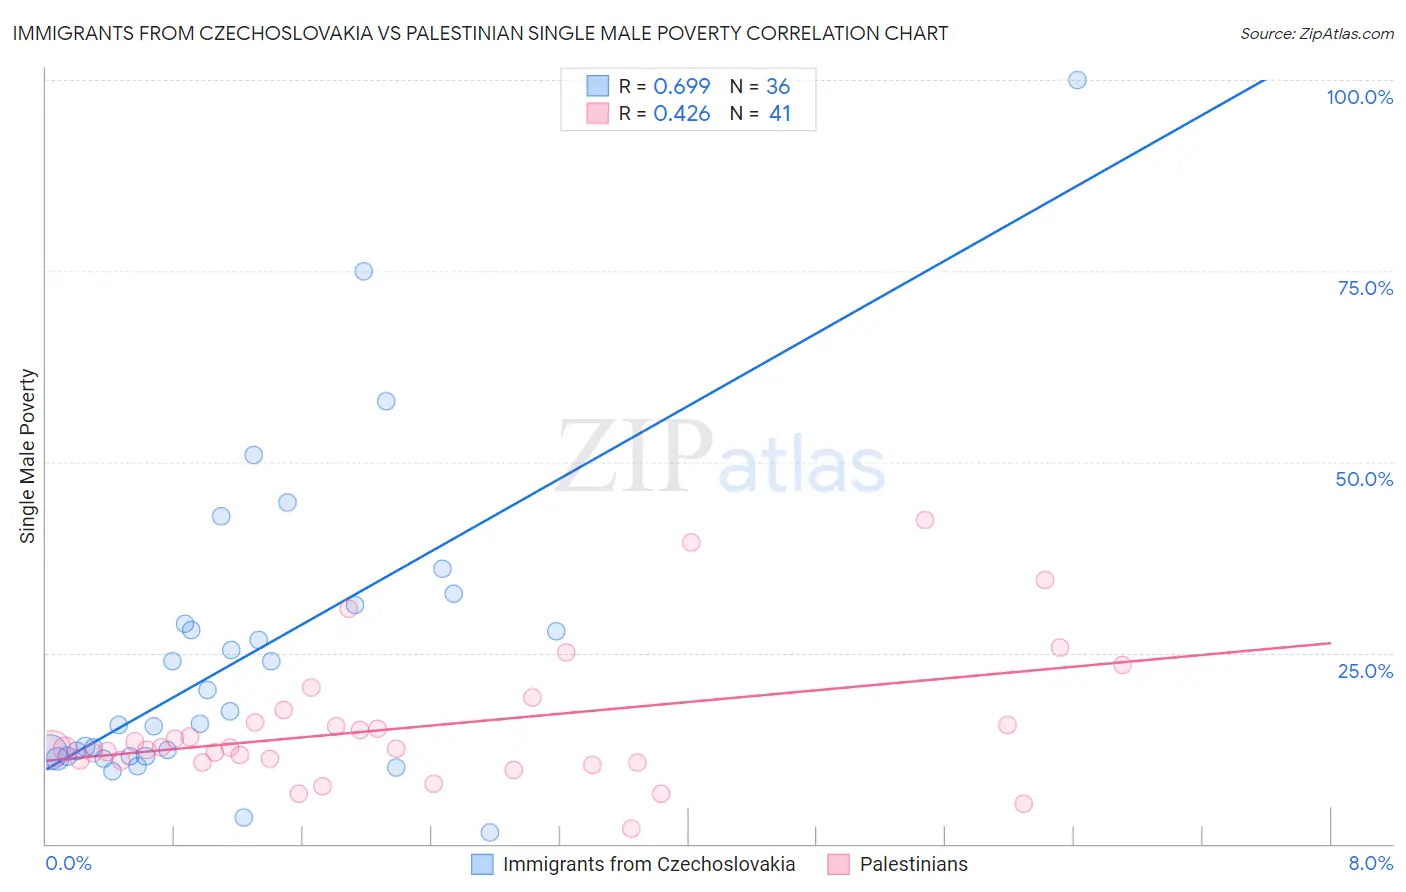
Immigrants from Czechoslovakia vs Palestinian Single Male Poverty Correlation Chart

The statistical analysis conducted on geographies consisting of 178,451,408 people shows a significant positive correlation between the proportion of Immigrants from Czechoslovakia and poverty level among single males in the United States with a correlation coefficient (R) of 0.699 and weighted average of 12.1%. Similarly, the statistical analysis conducted on geographies consisting of 200,638,280 people shows a moderate positive correlation between the proportion of Palestinians and poverty level among single males in the United States with a correlation coefficient (R) of 0.426 and weighted average of 12.7%, a difference of 5.2%.
Immigrants from Czechoslovakia vs Palestinian Single Male Poverty

Single Male Poverty Correlation Summary

MeasurementImmigrants from CzechoslovakiaPalestinian
Minimum1.5%1.9%
Maximum100.0%42.4%
Range98.5%40.5%
Mean24.8%15.3%
Median16.5%12.5%
Interquartile 25% (IQ1)11.4%10.8%
Interquartile 75% (IQ3)30.0%16.7%
Interquartile Range (IQR)18.6%5.9%
Standard Deviation (Sample)20.4%8.7%
Standard Deviation (Population)20.2%8.6%

Similar Demographics by Single Male Poverty

Demographics Similar to Immigrants from Czechoslovakia by Single Male Poverty

In terms of single male poverty, the demographic groups most similar to Immigrants from Czechoslovakia are Immigrants from Chile (12.1%, a difference of 0.020%), Immigrants from Colombia (12.1%, a difference of 0.030%), Immigrants from South America (12.1%, a difference of 0.080%), Turkish (12.1%, a difference of 0.080%), and Immigrants from Israel (12.1%, a difference of 0.090%).
DemographicsRating | RankSingle Male Poverty
Immigrants | Malaysia
99.2
/100
|
#77
Exceptional
12.0%
Immigrants | Venezuela
99.1
/100
|
#78
Exceptional
12.0%
Immigrants | Belgium
99.0
/100
|
#79
Exceptional
12.0%
Armenians
98.7
/100
|
#80
Exceptional
12.1%
Immigrants | South America
98.7
/100
|
#81
Exceptional
12.1%
Immigrants | Colombia
98.6
/100
|
#82
Exceptional
12.1%
Immigrants | Chile
98.6
/100
|
#83
Exceptional
12.1%
Immigrants | Czechoslovakia
98.6
/100
|
#84
Exceptional
12.1%
Turks
98.5
/100
|
#85
Exceptional
12.1%
Immigrants | Israel
98.5
/100
|
#86
Exceptional
12.1%
South Americans
98.5
/100
|
#87
Exceptional
12.1%
Immigrants | Eritrea
98.5
/100
|
#88
Exceptional
12.1%
Immigrants | Ireland
98.3
/100
|
#89
Exceptional
12.1%
South American Indians
98.3
/100
|
#90
Exceptional
12.1%
Immigrants | Turkey
98.2
/100
|
#91
Exceptional
12.1%

Demographics Similar to Palestinians by Single Male Poverty

In terms of single male poverty, the demographic groups most similar to Palestinians are Eastern European (12.7%, a difference of 0.010%), Immigrants from Nigeria (12.7%, a difference of 0.010%), Immigrants from Africa (12.7%, a difference of 0.020%), Immigrants from Cambodia (12.7%, a difference of 0.050%), and Immigrants from Liberia (12.7%, a difference of 0.060%).
DemographicsRating | RankSingle Male Poverty
Vietnamese
67.9
/100
|
#156
Good
12.7%
Latvians
67.9
/100
|
#157
Good
12.7%
Immigrants | Middle Africa
64.9
/100
|
#158
Good
12.7%
Immigrants | Liberia
64.2
/100
|
#159
Good
12.7%
Greeks
64.1
/100
|
#160
Good
12.7%
Immigrants | Africa
63.4
/100
|
#161
Good
12.7%
Eastern Europeans
63.3
/100
|
#162
Good
12.7%
Palestinians
63.1
/100
|
#163
Good
12.7%
Immigrants | Nigeria
62.8
/100
|
#164
Good
12.7%
Immigrants | Cambodia
62.2
/100
|
#165
Good
12.7%
Immigrants | Guyana
60.5
/100
|
#166
Good
12.7%
Immigrants | Sudan
58.2
/100
|
#167
Average
12.7%
Immigrants | Barbados
57.7
/100
|
#168
Average
12.7%
Puget Sound Salish
54.3
/100
|
#169
Average
12.8%
Guyanese
52.0
/100
|
#170
Average
12.8%